• Peer Review
  • Non-profit
  • Global Open Access
  • Green Channel for Rising Stars
Volume 11 Issue 1
Jan.  2024
Turn off MathJax
Article Contents

WANG Ming, MENG Dan, XU Peihua, et al. Validation and evaluation of the China meteorological administration wind energy and solar energy forecasting system (CMA-WSP) in short-term wind resource forecasting [J]. Southern energy construction, 2024, 11(1): 73-84. DOI: 10.16516/j.ceec.2024.1.08 doi:  10.16516/j.ceec.2024.1.08
Citation: WANG Ming, MENG Dan, XU Peihua, et al. Validation and evaluation of the China meteorological administration wind energy and solar energy forecasting system (CMA-WSP) in short-term wind resource forecasting [J]. Southern energy construction, 2024, 11(1): 73-84. DOI: 10.16516/j.ceec.2024.1.08 doi:  10.16516/j.ceec.2024.1.08

Validation and Evaluation of the China Meteorological Administration Wind Energy and Solar Energy Forecasting System (CMA-WSP) in Short-Term Wind Resource Forecasting

doi: 10.16516/j.ceec.2024.1.08
  • Received Date: 2023-07-21
  • Rev Recd Date: 2023-08-03
  • Available Online: 2023-08-21
  • Publish Date: 2024-01-10
  •   Introduction  To test the reliability of the CMA-WSP wind speed product in short-term wind resource forecasting, the CMA-WSP 3 d wind speed forecasting product with a wind speed of 100 m is tested and analyzed.   Method  This research was based on the measured data of 100 m wind speed in three wind farms in Zaoyang Zhoulou, Macheng Caijiazhai and Central Dajin.   Result  The results are as follows: (1) CMA-WSP has a good overall forecasting performance on the wind speed in Zaoyang wind farm within three days. The forecasted results are consistent with the measured wind speed change trend. The correlation between the forecasted and the measured wind speed on the first day are 0.728, 0.74 and 0.86 for 15 min intervals, hourly averages, and daily averages, respectively. (2) The relative error between the CMA-WSP forecast and the measured wind speed shows a strong regularity. The relative errors for the forecasted wind speed on the first day are 68 %, 70 % and 92 % for 15 min intervals, hourly averages, and daily averages, respectively. The forecasted wind speed is higher than the measured wind speed. The hourly average wind speed and relative error are characterized by low wind speed during the day and high wind speed at night. The change of monthly average wind speed is opposite to the change of MRE value, and it is the lowest from January to June and from October to December, and the highest from July to September. (3) When considering regional differences, CMA-WSP has the best forecasting effect on the wind speed in Zaoyang wind farm. The correlation between the forecasted and the measured wind speed on the first day can reach 0.728, and the correlation on the second to third days is also more than 0.6. The correlation between the forecasted wind speed and the measured wind speed in Caijiazhai and Central Dajin by CMA-WSP is less than 0.6.   Conclusion  CMA-WSP forecasting performance is favorable as a whole, and the relative error has strong regularity. It is beneficial to revise the product and reduce the error level in the next step.
  • [1] 王倩倩, 余晔, 董龙翔, 等. 基于激光测风雷达的兰州冬季风场特征及其与大气污染的关系 [J]. 高原气象, 2020, 39(3): 641-650. DOI:  10.7522/j.issn.1000-0534.2019.00009.

    WANG Q Q, YU Y, DONG L X, et al. Characteristics of winter wind field in Lanzhou based on scanning lidar and its relation to air pollution [J]. Plateau meteorology, 2020, 39(3): 641-650. DOI:  10.7522/j.issn.1000-0534.2019.00009.
    [2] 潘超, 谭启德, 蔡国伟, 等. 基于递归量化分析的COA-SVR短期风速混合预测模型 [J]. 电网技术, 2018, 42(8): 2373-2381. DOI:  10.13335/j.1000-3673.pst.2018.0137.

    PAN C, TAN Q D, CAI G W, et al. Hybrid short-term wind speed prediction model by COA-SVR based on recursive quantitative analysis [J]. Power system technology, 2018, 42(8): 2373-2381. DOI:  10.13335/j.1000-3673.pst.2018.0137.
    [3] WANG Z Y, QIN H Y, LEWIS J I. China's wind power industry: policy support, technological achievements, and emerging challenges [J]. Energy policy, 2012, 51: 80-88. DOI:  10.1016/j.enpol.2012.06.067.
    [4] SANTOS J A, ROCHINHA C, LIBERATO M L R, et al. Projected changes in wind energy potentials over Iberia [J]. Renewable energy, 2015, 75: 68-80. DOI:  10.1016/j.renene.2014.09.026.
    [5] 向玲, 邓泽奇, 赵玥. 基于LPF-VMD和KELM的风速多步预测模型 [J]. 电网技术, 2019, 43(12): 4461-4467. DOI:  10.13335/j.1000-3673.pst.2019.0176.

    XIANG L, DENG Z Q, ZHAO Y. Multi-step wind speed prediction model based on LPF-VMD and KELM [J]. Power system technology, 2019, 43(12): 4461-4467. DOI:  10.13335/j.1000-3673.pst.2019.0176.
    [6] 史可琴, 王方雨, 梁琛, 等. 基于随机过程自相关性的风速预测模型分析 [J]. 电网技术, 2017, 41(2): 529-535. DOI:  10.13335/j.1000-3673.pst.2016.0949.

    SHI K Q, WANG F Y, LIANG C, et al. New wind speed prediction model based on random process considering autocorrelation [J]. Power system technology, 2017, 41(2): 529-535. DOI:  10.13335/j.1000-3673.pst.2016.0949.
    [7] PETERSEN E L, MORTENSEN N G, LANDBERG L, et al. Wind power meteorology. Part I: climate and turbulence [J]. Wind energy, 1998, 1(1): 2-22. DOI: 10.1002/(SICI)1099-1824(199809)1:1<2:AID-WE15>3.0.CO;2-Y.
    [8] AYOTTE K W, DAVY R J, COPPIN P A. A simple temporal and spatial analysis of flow in complex terrain in the context of wind energy modelling [J]. Boundary-layer meteorology, 2001, 98(2): 275-295. DOI:  10.1023/A:1026583021740.
    [9] MANWELL J F, ROGERS A L, MCGOWAN J G, et al. An offshore wind resource assessment study for New England [J]. Renewable energy, 2002, 27(2): 175-187. DOI:  10.1016/S0960-1481(01)00183-5.
    [10] 徐晶晶, 胡非, 肖子牛, 等. 风能模式预报的相似误差订正 [J]. 应用气象学报, 2013, 24(6): 731-740. DOI:  10.3969/j.issn.1001-7313.2013.06.010.

    XU J J, HU F, XIAO Z N, et al. Analog bias correction of numerical model on wind power prediction [J]. Journal of applied meteorological science, 2013, 24(6): 731-740. DOI:  10.3969/j.issn.1001-7313.2013.06.010.
    [11] 肖洋. 风电场风速和发电功率预测研究 [D]. 吉林: 东北电力大学, 2005. DOI: 10.7666/d.Y1014228.

    XIAO Y. Wind speed and power prediction of wind farm [D]. Jilin: Northeast Electric Power University, 2005. DOI: 10.7666/d.Y1014228.
    [12] 吴国旸, 肖洋, 翁莎莎. 风电场短期风速预测探讨 [J]. 吉林电力, 2005(6): 21-24. DOI:  10.3969/j.issn.1009-5306.2005.06.007.

    WU G Y, XIAO Y, WENG S S. Discussion about short-term forecast of wind speed on wind farm [J]. Jilin electric power, 2005(6): 21-24. DOI:  10.3969/j.issn.1009-5306.2005.06.007.
    [13] 石岚, 徐丽娜, 郝玉珠. 多模式风速融合预报应用研究 [J]. 高原气象, 2017, 36(4): 1022-1028. DOI:  10.7522/j.issn.1000-0534.2017.00021.

    SHI L, XU L N, HAO Y Z. Application research on the multi-model fusion forecast of wind speed [J]. Plateau meteorology, 2017, 36(4): 1022-1028. DOI:  10.7522/j.issn.1000-0534.2017.00021.
    [14] 马金玉, 罗勇, 申彦波, 等. 太阳能预报方法及其应用和问题 [J]. 资源科学, 2011, 33(5): 829-837.

    MA J Y, LUO Y, SHEN Y B, et al. A review on methods of solar energy forecasting and its application [J]. Resources science, 2011, 33(5): 829-837.
    [15] 王明欢, 赖安伟, 陈正洪, 等. WRF模式模拟的地表短波辐射与实况对比分析 [J]. 气象, 2012, 38(5): 585-592. DOI:  10.7519/j.issn.1000-0526.2012.05.009.

    WANG M H, LAI A W, CHEN Z H, et al. Comparison of WRF forecast downward shortwave radiation with observations—a pilot study [J]. Meteorology, 2012, 38(5): 585-592. DOI:  10.7519/j.issn.1000-0526.2012.05.009.
    [16] 郑婷婷, 单小雨, 马继涛, 等.寒潮天气对风电运行和功率预测的影响分析[J]. 内蒙古电力技术, 2023, 41(4): 8-12.DOI:  10.19929/j.cnki.nmgdljs.2023.0048

    ZHENG T T, SHAN X Y, MA J T, et al. Impact of cold wave weather on wind power operation and power prediction[J]. Inner Mongolia electric power, 2023, 41(4): 8-12. DOI:  10.19929/j.cnki.nmgdljs.2023.0048
    [17] 张永蕊, 阎洁, 林爱美, 等. 多点数值天气预报风速和辐照度集中式修正方法研究 [J]. 发电技术, 2022, 43(2): 278-286. DOI:  10.12096/j.2096-4528.pgt.22005.

    ZHANG Y R, YAN J, LIN A M, et al. Integrated correction method of multi-point numerical weather prediction wind speed and irradiance [J]. Power generation technology, 2022, 43(2): 278-286. DOI:  10.12096/j.2096-4528.pgt.22005.
    [18] 刘桂艳, 连喜虎, 高松, 等. WRF模式对渤海和黄海海面风预报误差分析 [J]. 防灾科技学院学报, 2023, 25(1): 40-48. DOI:  10.3969/j.issn.1673-8047.2023.01.005.

    LIU G Y, LIAN X H, GAO S, et al. Analysis of sea surface wind prediction error in the Bohai Sea and the Yellow Sea by WRF model [J]. Journal of institute of disaster prevention, 2023, 25(1): 40-48. DOI:  10.3969/j.issn.1673-8047.2023.01.005.
    [19] 肖瑶, 席世平, 王丽. 河南高速公路沿线最大风速精细化预报产品检验及订正研究 [J]. 气象与环境科学, 2022, 45(3): 29-35. DOI:  10.16765/j.cnki.1673-7148.2022.03.004.

    XIAO Y, XI S P, WANG L. Research on refined forecast test and correction of maximum wind speed along expressway in Henan Province [J]. Meteorological and environmental sciences, 2022, 45(3): 29-35. DOI:  10.16765/j.cnki.1673-7148.2022.03.004.
    [20] 吴骥, 陈卫东, 字俣丞, 等. 寒潮天气过程对风/光伏发电资源要素数值预报技巧影响的检验分析 [J]. 气候与环境研究, 2022, 27(6): 769-777. DOI:  10.3878/j.issn.1006-9585.2021.21173.

    WU J, CHEN W D, ZI Y C, et al. Verification and analysis of the impact of cold wave weather process on the numerical prediction skills of wind/photovoltaic power resource elements [J]. Climatic and environmental research, 2022, 27(6): 769-777. DOI:  10.3878/j.issn.1006-9585.2021.21173.
    [21] 程兴宏, 陶树旺, 魏磊, 等. 基于WRF模式和自适应偏最小二乘回归法的风能预报试验研究 [J]. 高原气象, 2012, 31(5): 1461-1469.

    CHENG X H, TAO S W, WEI L, et al. Short-term wind power forecasting experiment based on WRF model and adapting partial least square regression method [J]. Plateau meteorology, 2012, 31(5): 1461-1469.
    [22] 夏晓玲, 尚媛媛, 郑奕. 贵州省数值预报风速产品检验及订正 [J]. 中低纬山地气象, 2019, 43(6): 30-36. DOI:  10.3969/j.issn.1003-6598.2019.06.005.

    XIA X L, SHANG Y Y, ZHENG Y. Verification and revision of numerical models for wind speed forecast in Guizhou Province [J]. Mid-low latitude mountain meteorology, 2019, 43(6): 30-36. DOI:  10.3969/j.issn.1003-6598.2019.06.005.
    [23] 余江, 江志红, 俞卫, 等. 风电场风速数值预报的误差分析及订正 [J]. 气象科学, 2015, 35(5): 587-592. DOI:  10.3969/2014jms.0013.

    YU J, JIANG Z H, YU W, et al. Error analysis and correction of wind speed numerical forecast at wind farm [J]. Journal of the meteorological sciences, 2015, 35(5): 587-592. DOI:  10.3969/2014jms.0013.
    [24] 息涛, 肖玉华, 明慧青, 等. 西南高原山地风能预测中风速预报的热动力订正研究 [C]//中国气象学会. 第34届中国气象学会年会S11创新驱动智慧气象服务——第七届气象服务发展论坛论文集, 郑州, 2017-09-27. 郑州: 中国气象学会, 2017.

    XI T, XIAO Y H, MING H Q, et al. Research on the thermodynamic correction of wind speed prediction in wind energy prediction in the southwest plateau and mountainous areas [C]//China Meteorological Society. The 34th Annual Meeting of the China Meteorological Society S11 Innovation Driven Smart Meteorological Service: The Seventh Meteorological Service Development Forum Proceedings, Zhengzhou, China, September 27, 2017. Zhengzhou: China Meteorological Society, 2017.
  • 通讯作者: 陈斌, bchen63@163.com
    • 1. 

      沈阳化工大学材料科学与工程学院 沈阳 110142

    1. 本站搜索
    2. 百度学术搜索
    3. 万方数据库搜索
    4. CNKI搜索

Figures(9)  / Tables(1)

Article Metrics

Article views(417) PDF downloads(93) Cited by()

Related

Validation and Evaluation of the China Meteorological Administration Wind Energy and Solar Energy Forecasting System (CMA-WSP) in Short-Term Wind Resource Forecasting

doi: 10.16516/j.ceec.2024.1.08

Abstract:   Introduction  To test the reliability of the CMA-WSP wind speed product in short-term wind resource forecasting, the CMA-WSP 3 d wind speed forecasting product with a wind speed of 100 m is tested and analyzed.   Method  This research was based on the measured data of 100 m wind speed in three wind farms in Zaoyang Zhoulou, Macheng Caijiazhai and Central Dajin.   Result  The results are as follows: (1) CMA-WSP has a good overall forecasting performance on the wind speed in Zaoyang wind farm within three days. The forecasted results are consistent with the measured wind speed change trend. The correlation between the forecasted and the measured wind speed on the first day are 0.728, 0.74 and 0.86 for 15 min intervals, hourly averages, and daily averages, respectively. (2) The relative error between the CMA-WSP forecast and the measured wind speed shows a strong regularity. The relative errors for the forecasted wind speed on the first day are 68 %, 70 % and 92 % for 15 min intervals, hourly averages, and daily averages, respectively. The forecasted wind speed is higher than the measured wind speed. The hourly average wind speed and relative error are characterized by low wind speed during the day and high wind speed at night. The change of monthly average wind speed is opposite to the change of MRE value, and it is the lowest from January to June and from October to December, and the highest from July to September. (3) When considering regional differences, CMA-WSP has the best forecasting effect on the wind speed in Zaoyang wind farm. The correlation between the forecasted and the measured wind speed on the first day can reach 0.728, and the correlation on the second to third days is also more than 0.6. The correlation between the forecasted wind speed and the measured wind speed in Caijiazhai and Central Dajin by CMA-WSP is less than 0.6.   Conclusion  CMA-WSP forecasting performance is favorable as a whole, and the relative error has strong regularity. It is beneficial to revise the product and reduce the error level in the next step.

WANG Ming, MENG Dan, XU Peihua, et al. Validation and evaluation of the China meteorological administration wind energy and solar energy forecasting system (CMA-WSP) in short-term wind resource forecasting [J]. Southern energy construction, 2024, 11(1): 73-84. DOI: 10.16516/j.ceec.2024.1.08 doi:  10.16516/j.ceec.2024.1.08
Citation: WANG Ming, MENG Dan, XU Peihua, et al. Validation and evaluation of the China meteorological administration wind energy and solar energy forecasting system (CMA-WSP) in short-term wind resource forecasting [J]. Southern energy construction, 2024, 11(1): 73-84. DOI: 10.16516/j.ceec.2024.1.08 doi:  10.16516/j.ceec.2024.1.08
    • 风能资源作为一种安全无污染的可再生资源,对风能资源的有效利用和开发,对能源结构的调整都具有极其重要的作用[1]。随着风电技术的成熟,风电行业不断发展与进步,风力发电在世界范围内得到了广泛的重视与应用[2],并且已成为装机容量仅次于水电的第2大可再生能源[3-4]。中国蕴含丰富的风资源,在能源结构中增大风能的比例可以为中国低碳发展战略的实施提供关键支撑。但风力发电具有间歇性和波动性的特点[5-6],容易受到气候因素的影响[7],因此,对气候变化背景下区域风能资源开展短期预报具有重大意义。

      随着数值模式技术水平的迅速提高,数值模式预报已成为中短期天气预报的基础。21世纪以来,美国True Wind Solutions公司在应用数值模式评估风能资源方面处于国际领先地位[8],其风能资源评估系统已应用于20多个国家和地区[9]。此外,在中国基于数值模式的风速预报,已有许多研究和业务实践工作[10-13]。为推动我国新能源行业发展,中国气象局预报司组织中国气象局公共气象服务中心、北京市气象局等单位,基于新一代高分辨率专业数值预报系统——RMAPS-Wind 1.0系统,改进中国气象局风能太阳能气象预报系统(China Meteorological Administration Wind and Solar Forecasting,CMA-WSP),制作了省级风能太阳能短期预报产品。目前,该模式直接输出的风能太阳能产品还难以直接应用于预报业务和气象服务中,输出产品与实际需求还存在较大差距[14-15]

      对数值模式预报结果进行客观检验和误差的定量分析,不仅能够为气象服务提供有力参考,同时也为数值预报结果的使用与订正提供数据支持,从而提高预报准确率[16-17]。刘桂艳等[18]选取渤海、黄海8个浮标站位观测的海面10 m风资料,对WRF模式的预报结果开展了对比检验和误差统计分析。肖瑶等[19]对河南主要高速公路沿线逐3 h最大风速精细化指导预报检验结果显示,预报产品表现出较好的预报能力,但仍存在较为明显的系统性偏差。吴骥等[20]基于ERA5再分析资料和NCEP的GFS预报系统的120 h预报资料,对华东地区2020年12月~2021年3月期间9次寒潮过程中数值模式的近地面风速预报技巧进行了检验。程兴宏[21]等利用甘肃2座测风塔50 m和70 m高度的实测资料,检验了WRF模式预报的2009年1月、4月、7月、10月该风电场附近的逐15 min的风速和风向,显示预报结果能较好地反应风速、风向的变化。夏晓玲等[22]运用概率统计的方法,检验了ECWMF、GRAPES和JAPAN模式对贵州省范围内84个站点风速预报的平均绝对误差、标准差、相关系数和正确率。目前,开展CMA-WSP模式对风资源短期预报准确率的分析评估工作还不多,CMA-WSP模式风速预报性能还需要进一步检验。

      为响应《湖北省气象局、湖北省能源局关于强化能源保供气象服务工作》方案,开发能源保供产品,建立全省未来3 d短期风资源预报产品,本研究利用湖北枣阳周楼、麻城蔡家寨和大金中部风电场逐15 min的100 m实测风速,对CMA-WSP风速产品在风资源短期预报中的应用开展检验评估,分析该预报产品的质量特点和误差产生原因,为下一步对该产品进行订正、降低误差水平打下基础,也为该产品在湖北风资源短期预报中的应用提供科学依据。

    • 自2015年开始,北京城市气象研究院建立了新一代高分辨率专业数值预报系统——RMAPS-Wind 1.0系统,为风电光伏电站的精细化预报提供实时风能太阳能数值预报基础产品。RMAPS-Wind系统的预报和资料同化模块分别基于WRF模式和WRFDA资料同化系统深入发展而建立。2019年12月,RMAPS-Wind 1.0系统作为风能太阳能专业气象预报系统的重要技术和数据支撑,通过了中国气象局预报与网络司的业务准入评审(气预函〔2019〕67号),正式实现业务运行。该系统采用单层嵌套覆盖中国区域,模拟区域水平分辨率为9 km,格点为649 km×550 km。垂直方向采用σ坐标,共51层,层顶气压为10 hPa。采用的模式版本为WRF v4.2.2,前处理模块为WPS v4.1.2,用于处理全球模式分析场和预报场数据的解码以及向中尺度网格点的插值,同化模块为WRFDA v4.1.2,采用三维变分同化技术进行各种观测资料的同化分析。采用的各类物理参数化设置如下:Thompson显式微物理方案、尺度适应的New Tiedtke对流参数化方案、YSU边界层方案、RRTMG长、短波辐射方案。

      CMA-WSP风速预报产品是中国气象局公共气象服务中心基于RMAPS-Wind 1.0输出气象要素制作而成的风能太阳能数值预报产品(以下简称CMA-WSP),该产品包括中国区域边界层分层温、湿、风场以及到达地表短波辐射、地面气压、降水量等风功率、光伏发电功率预报所需气象要素,时间分辨率为15 min,空间分辨率为9 km,预报时效为126 h,预报频次为1次/d,即每1 d预报数据都包含未来5 d的预报结果,本文只检验前3 d的预报效果。由于RMAPS-Wind 1.0输出风速产品为51层,CMA-WSP模式对风速的预报包含4个高度层,分别为15~20 m、45~50 m、100~110 m和190~200 m,考虑到100 m风速是目前风资源短期预报中最常用到的变量,且CMA-WSP 1.0产品于2022年3月20日发布,因此,本文选取2022年4月1日~2023年3月31日1个完整年的100 m高度风速预报数据作为被检验数据。

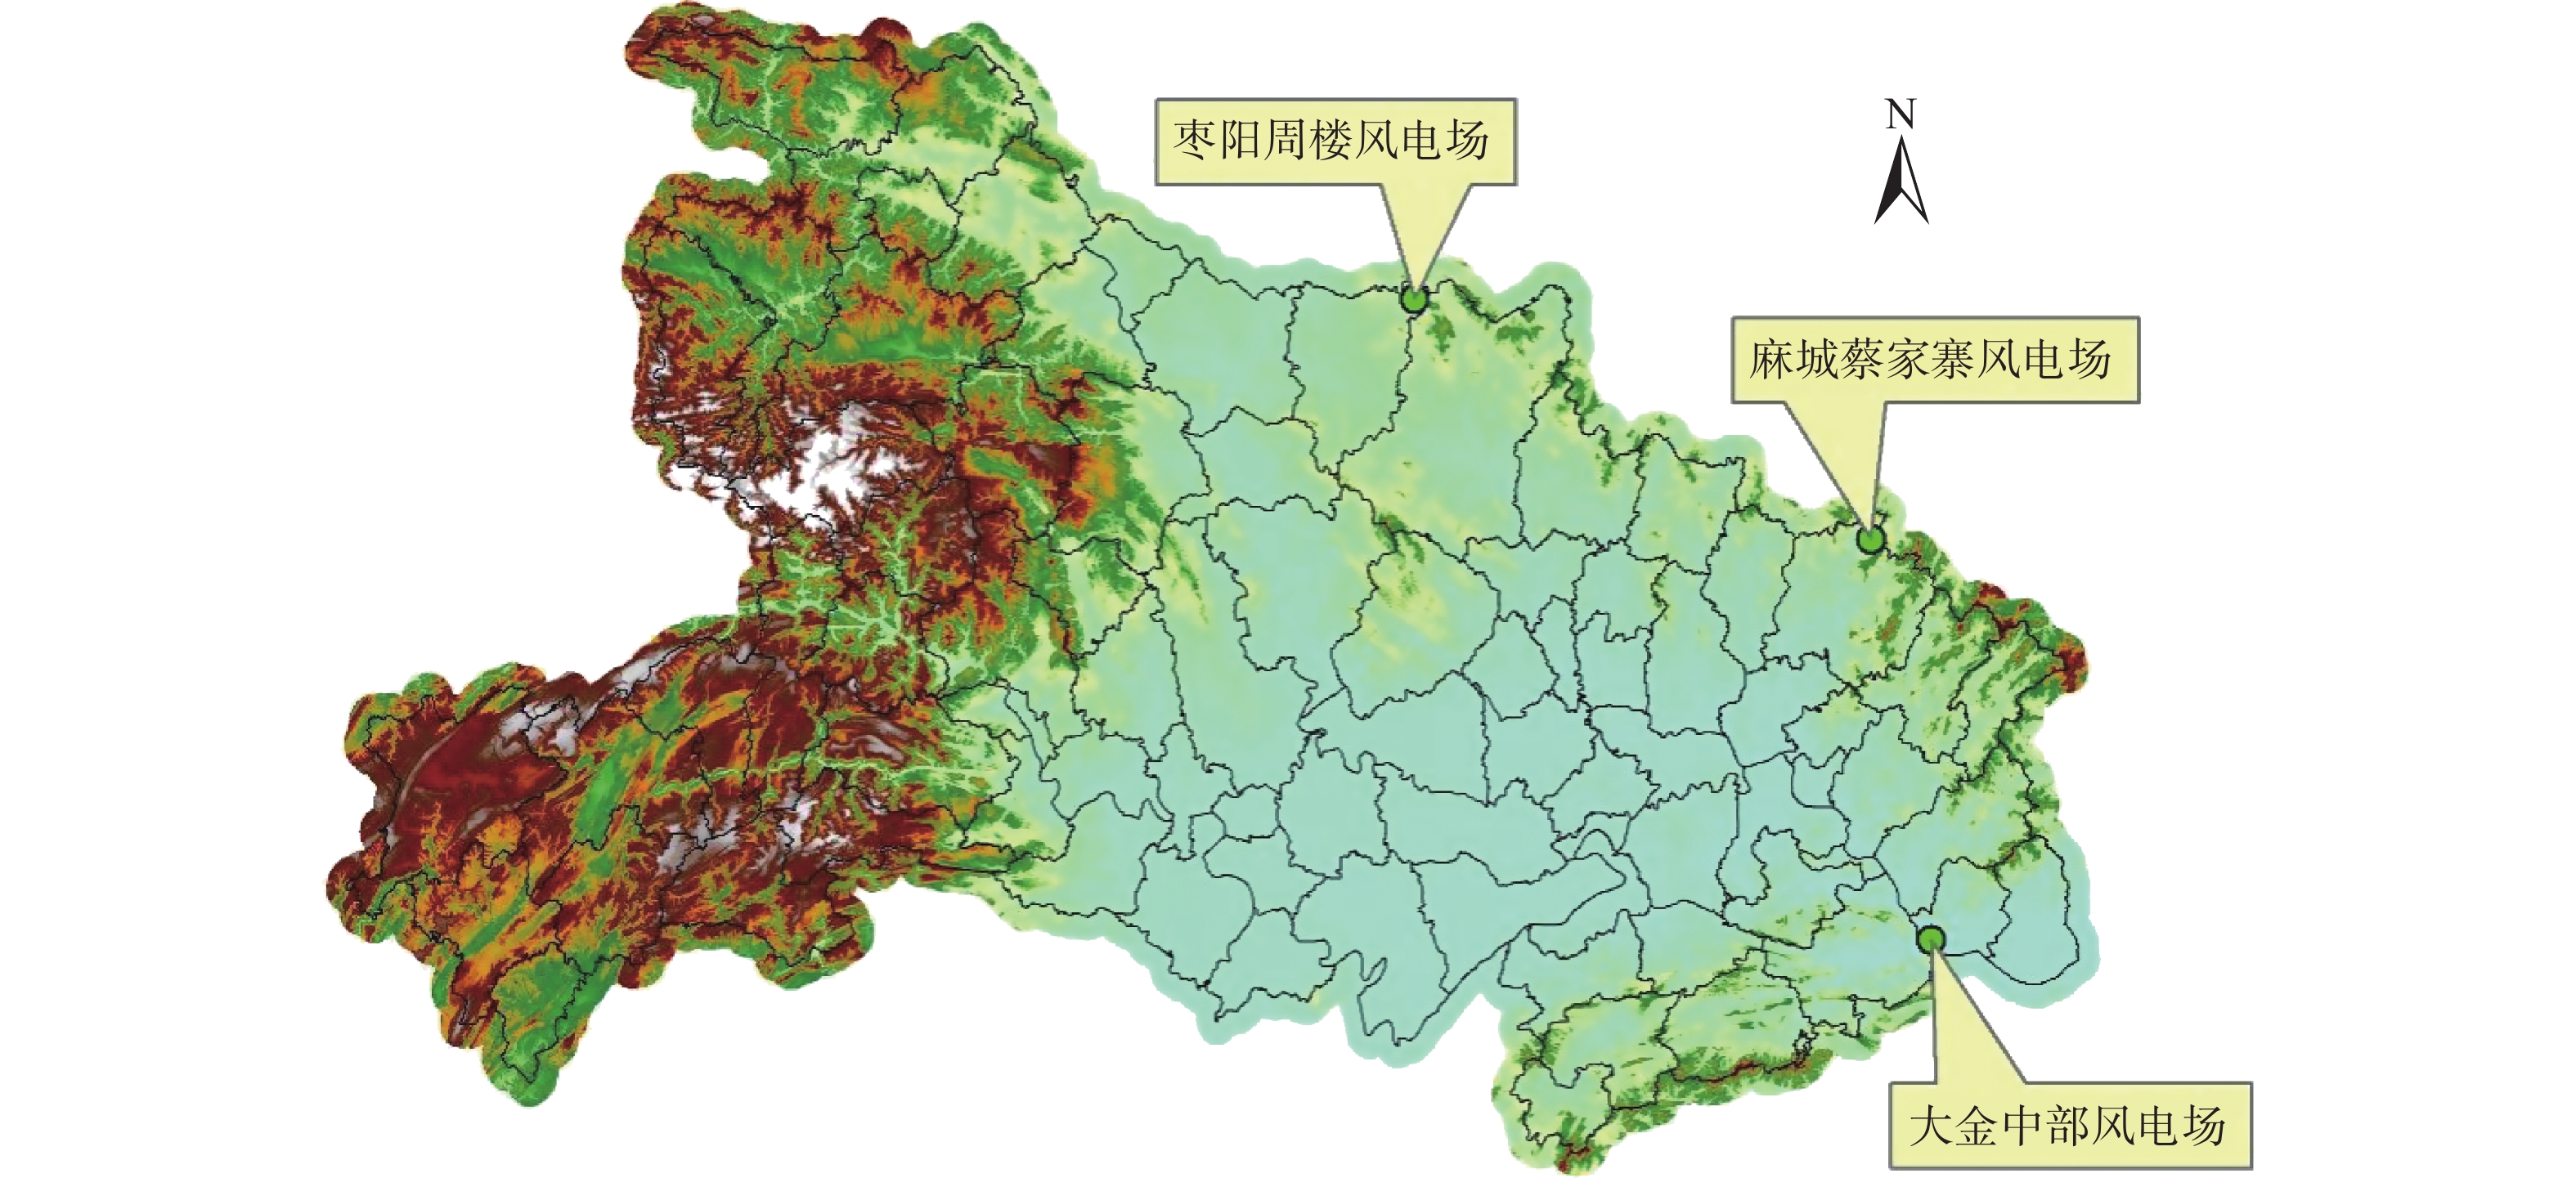
    • 本文选取湖北省境内3个风电场作为代表站,分别为:枣阳周楼风电场、麻城蔡家寨风电场、大金中部风电场,海拔高度分别为440.32 m、671.32 m和372.37 m。其中,枣阳周楼风电场共16台风机,包含15台3 MW风机和1台2 MW风机,装机容量共47 MW;麻城蔡家寨风电场共25台风机,均为2 MW风机,装机容量为50 MW;大金中部共13台风机,均为2 MW风机,装机容量为26 MW。风电场各风电场分布如图1所示。采用风机轮毂100 m高度处逐15 min的所有风机实测的平均风速,风速记录均经过校正,数据完整率分别为100%、70.88%和78.17%。

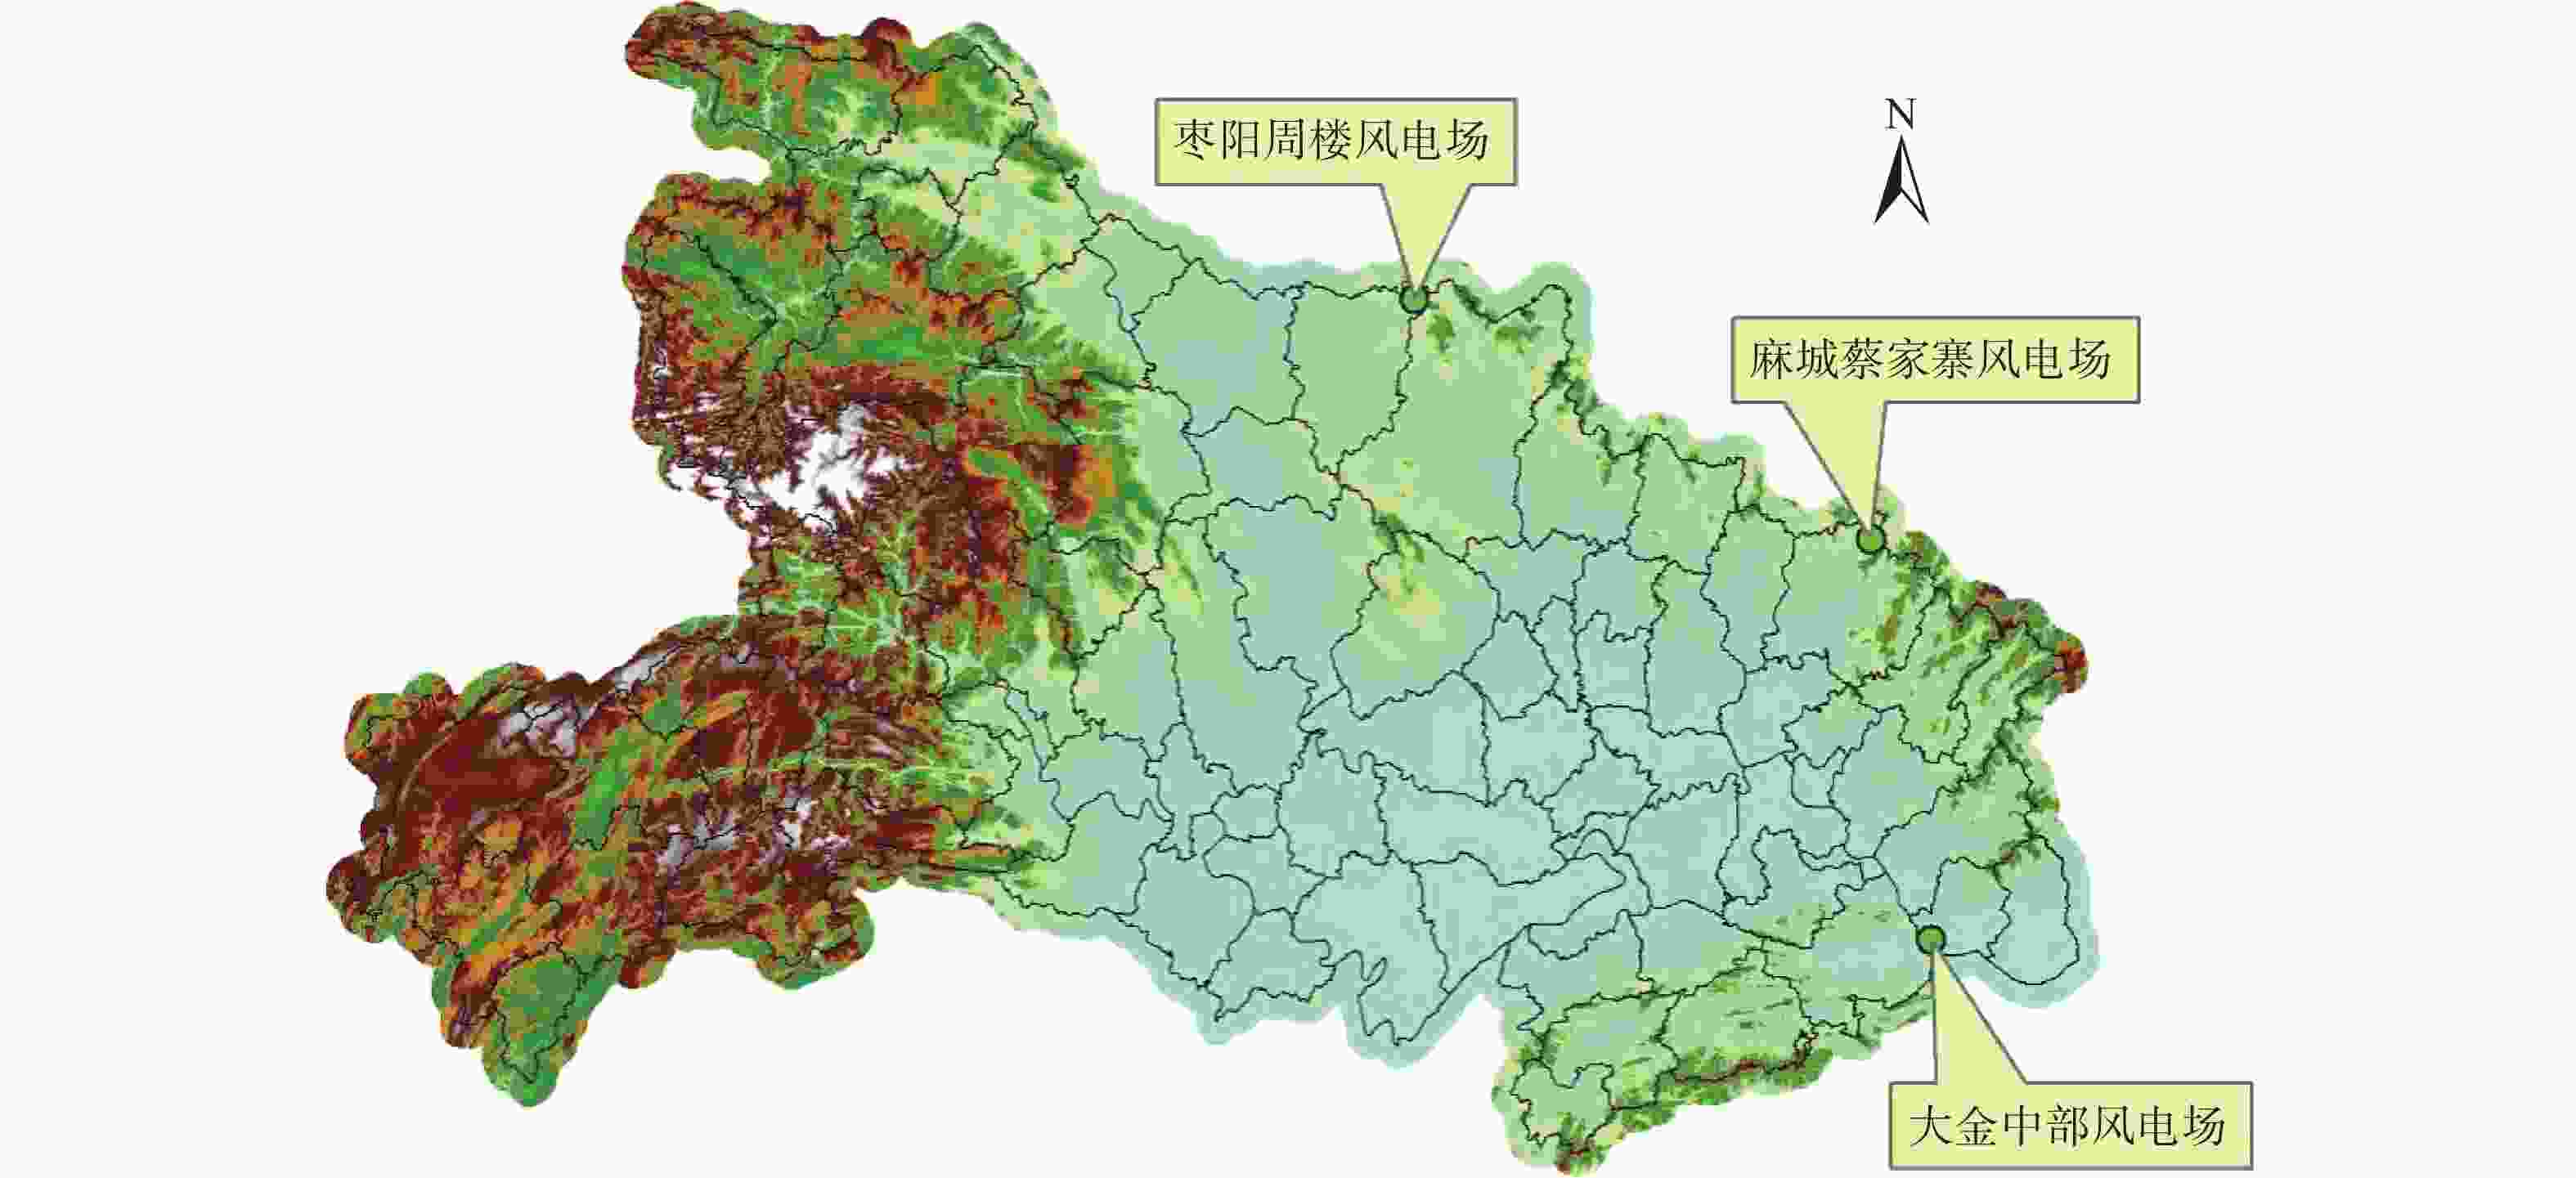
      Figure 1.  Spatial distribution diagram of wind farm

    • 本文利用风电场的实测风速资料,通过对比分析CMA-WSP预报风速的相关系数(R)、均方根误差(RMSE)、相对误差(MRE)、平均偏差(MB)和平均绝对偏差(AMB),来进行CMA-WSP模式风速预报的效果检验,这些指标均能反映预报值和实测值的差别。

      $ {E}_{i} $、$ {Q}_{i} $分别表示CMA-WSP的预报风速和风电场的实测风速,$ \stackrel{-}{E} $和$ \stackrel{-}{O} $分别表示它们的平均值,N表示统计时段内样本总量,$ i $表示统计时段内样本序号。R、RMSE、MRE、MB和AMB的计算方法依次如下:

      $$ 相关系数: R=\frac{\displaystyle \sum _{i=1}^{N}({E}_{i}-\stackrel-{E})({Q}_{i}-\stackrel-{O})}{\sqrt{\displaystyle \sum _{i=1}^{N}{({E}_{i}-\stackrel-{E})}^{2}}\displaystyle \sum _{i=1}^{N}{({O}_{i}-\stackrel-{O})}^{2}} $$ (1)
      $$均方根误差: {{\rm{RMS}} {\rm{E}}}=\sqrt{\frac{1}{N}\sum _{i=1}^{N}{({E}_{i}-{O}_{i})}^{2}} $$ (2)
      $$ 相对误差:{\rm{MRE}}=\frac{1}{N}\sum _{i=1}^{N}\left(\frac{\left({E}_{i}-{O}_{i}\right)}{{O}_{i}}\right) $$ (3)
      $$ 平均偏差:{\rm{MB}}=\frac{1}{N}\sum _{i=1}^{N}({E}_{i}-{O}_{i}) $$ (4)
      $$ 平均绝对偏差:{\rm{AMB}}=\frac{1}{N}\sum _{i=1}^{N}\left(\right|{E}_{i}-{O}_{i}\left|\right) $$ (5)
    • 本文目的是检验评估CMA-WSP预报的100 m风速在风资源短期预报中的适用性,CMA-WSP预报风速分为4个高度层,其中第3层风速高度为100~110 m,同一时次不同格点风速的高度不同。为确保CMA-WSP模式预报风速评估的准确性,需先提取风速预报中各高度层的风速,再基于线性插值方法将风速插值到100 m,从而对100 m预报风速开展评估检验。

    • 本文先以枣阳风场站为例,检验15 min、小时、日、月时间尺度下CMA-WSP预报风速的预报效果,并分析其特征。进而横向对比CMA-WSP预报风速在枣阳周楼、蔡家寨和大金中部3个风电场的预报发表效果。

    • CMA-WSP前3 d预报与枣阳风电场实测逐15 min风速随时间的变化如图2(a)、图2(c)、图2(e)所示,预报风速与风电场实测数据变化趋势一致,同时,CMA-WSP预报风速整体要高于实测风速。从数值上来看,枣阳风电场逐15 min的风速介于0~19.9 m/s之间,风速年平均值为4.83 m/s,CMA-WSP前3 d预报风速分别介于0~26.1 m/s、0~24.8 m/s、0~22.9 m/s之间,年平均值分别为6.70 m/s、6.83 m/s和6.88 m/s,表明CMA-WSP模式对风速的预报普遍偏高。考虑到CMA-WSP模式预报的风速是4个高度层的风速,其中第3个高度层风速高度为100~110 m,因此,预报风速会存在一定偏大。

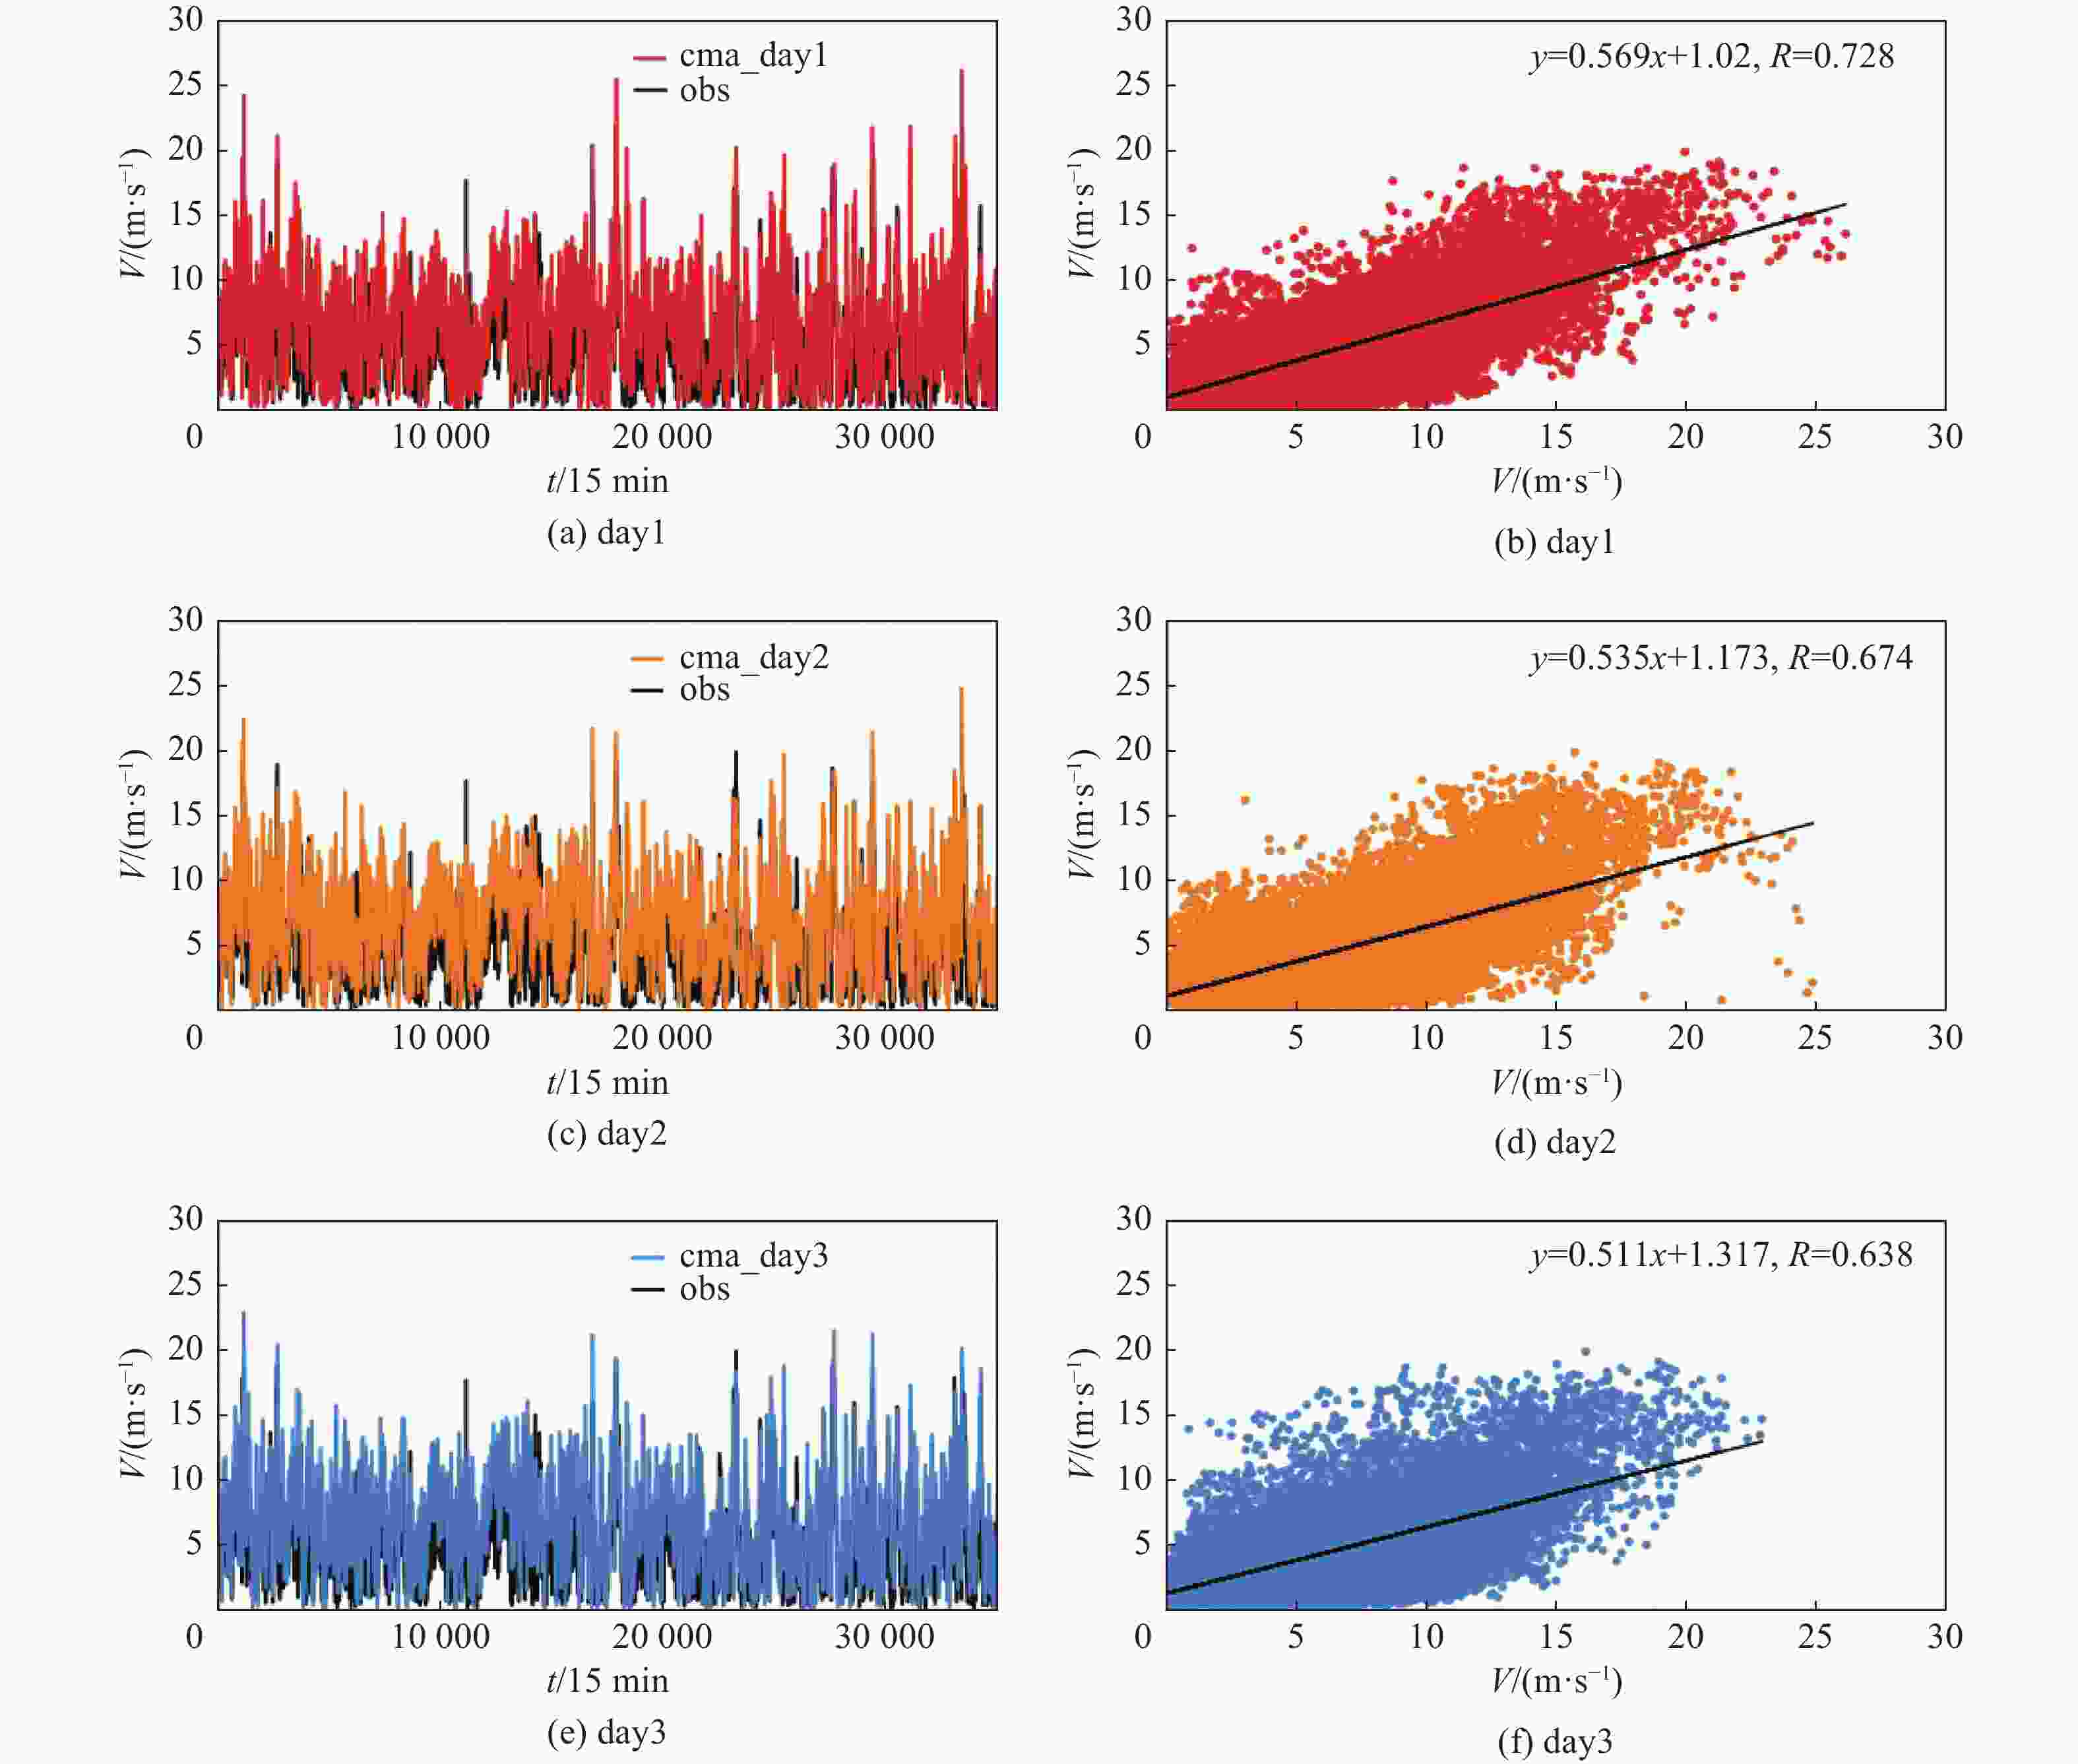
      Figure 2.  The wind speed time series (a, c, e) in 15 min intervals and correlation (b, d, f) of the first 3 days of CMA-WSP forecast and the measured wind speed in Zaoyang wind farm

      CMA-WSP前3 d预报与枣阳风电场实测逐15 min风速相关如图2(b)、图2(d)、图2(f)所示,实测风速与3 d预报风速的相关系数分别为0.728、0.674、0.638,均通过了置信度区间为95%水平的显著性检验,可见CMA-WSP对100 m风速的预报效果较好,且随着预报时效增加,预报效果略有降低。

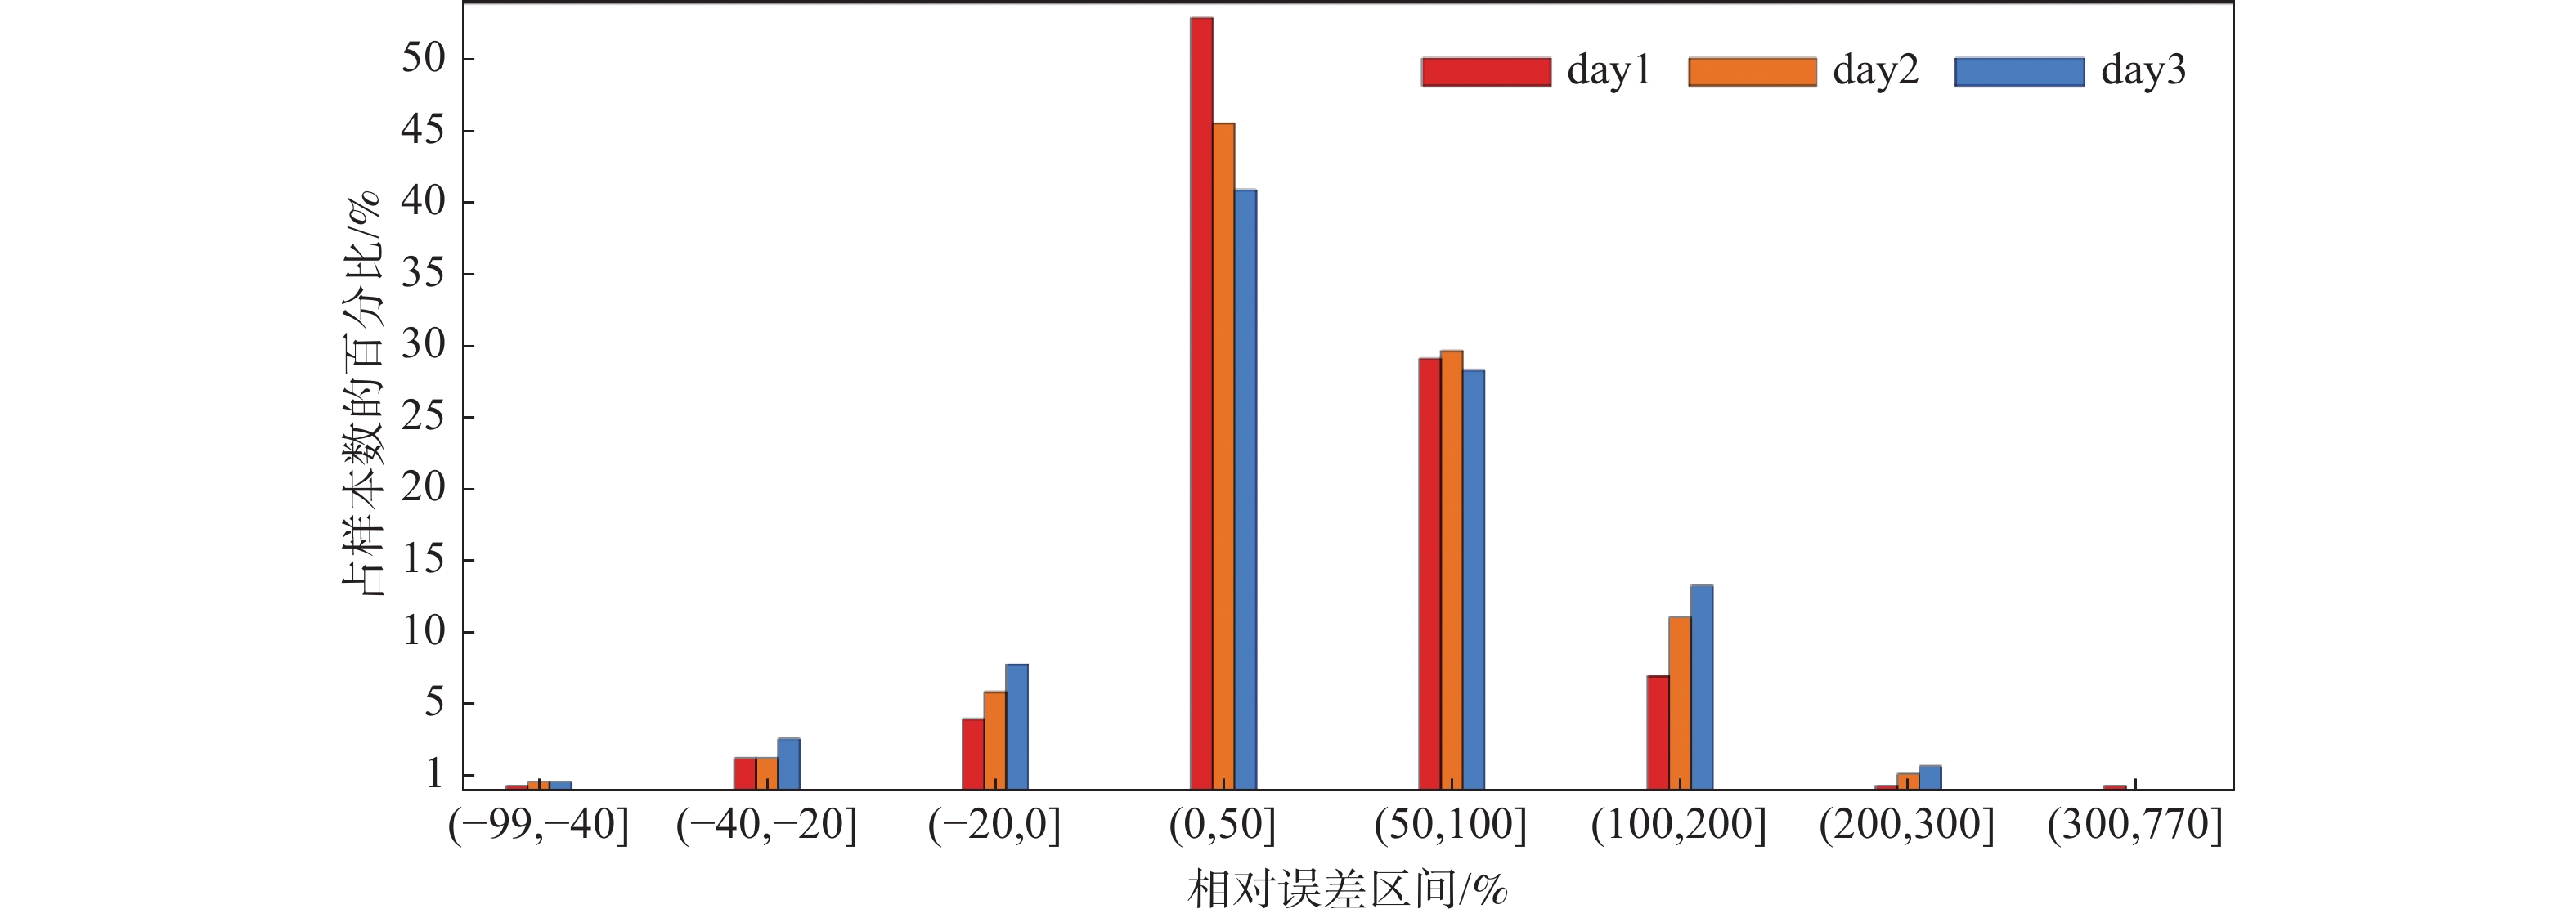
      从CMA-WSP前3 d预报与枣阳风电场实测风速相对误差区间分布来看,MRE值主要集中在MRE值为200%区间内,数据占比分别为68%、67%和66%,其中,MRE值在50%内的数据分别占34%、32%和29%,负偏差占比约为23%,预报风速比枣阳风电场实测风速数值要偏高。此外,在−40%~100%的MRE值区间内,第1 d的预报数据占比要高于第2 d和第3 d,表明第1 d预报风速的MRE值整体要高于第2 d和第3 d,如图3所示。

      Figure 3.  The distribution of relative errors between the CMA-WSP forecast and the measured wind speed in Zaoyang wind farm in 15 min intervals

    • 图4所示,可以看出CMA-WSP前3 d预报与枣阳风电场实测小时平均风速时间序列及相关关系,预报与实测小时平均风速变化趋势较为一致,从数值上来看,3 d预报风速分别介于0~25.2 m/s、0~23.8 m/s和0~22.6 m/s之间,整体高于实测风速0~18.7 m/s。从预报与实测相关性来看,3 d预报与实测相关系数分别为0.740、0.685和0.648,均通过了置信度区间为95%水平的显著性检验。

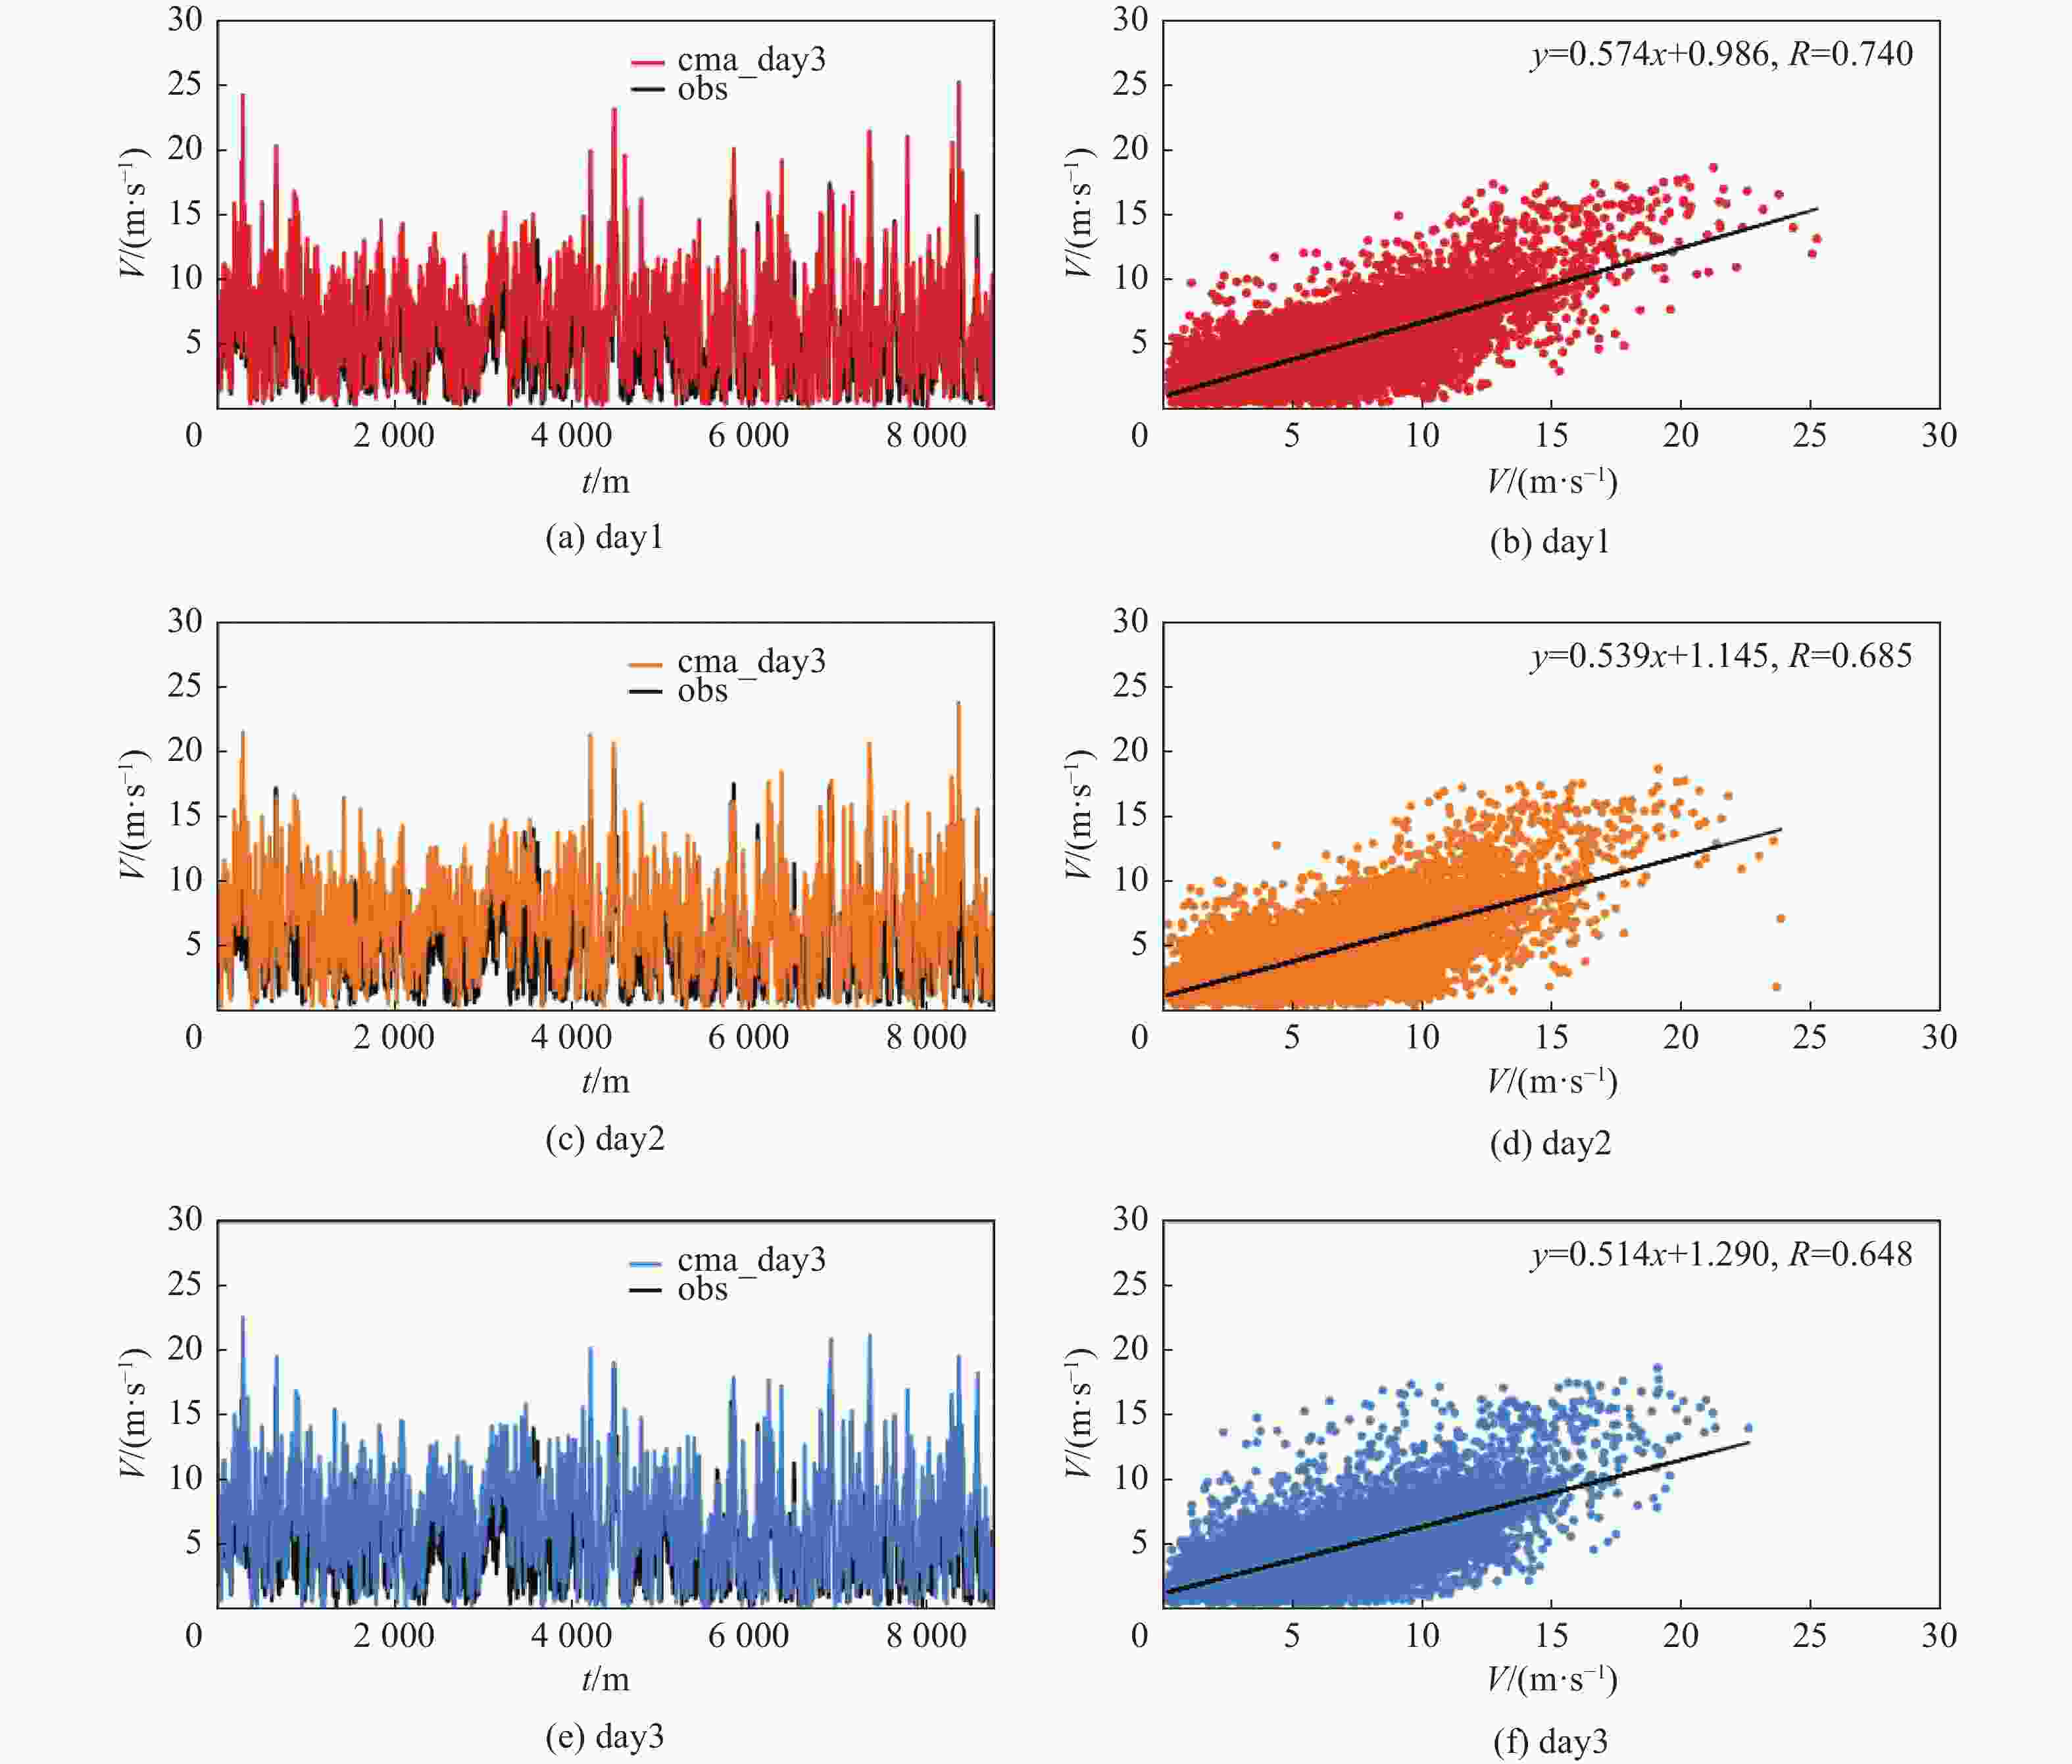
      Figure 4.  The hourly average wind speed time series (a, c, e) and correlation (b, d, f) between CMA-WSP forecast and the measured wind speed in Zaoyang wind farm in the first 3 days

      从CMA-WSP前3 d预报与枣阳风电场实测小时平均风速相对误差区间分布来看,MRE值在200%区间内的数据分别为70%、68%、67%,其中,MRE在50%以内的数据占比分别为35%、33%和30%,负偏差的数据占比约为23%,预报比枣阳风电场站实测小时平均风速数值偏高。此外,在MRE值区间−40%~100%内,第1 d的预报数据占比要高于第2 d和第3 d,第1 d预报风速的MRE值整体要高于第2 d和第3 d,如图5所示。

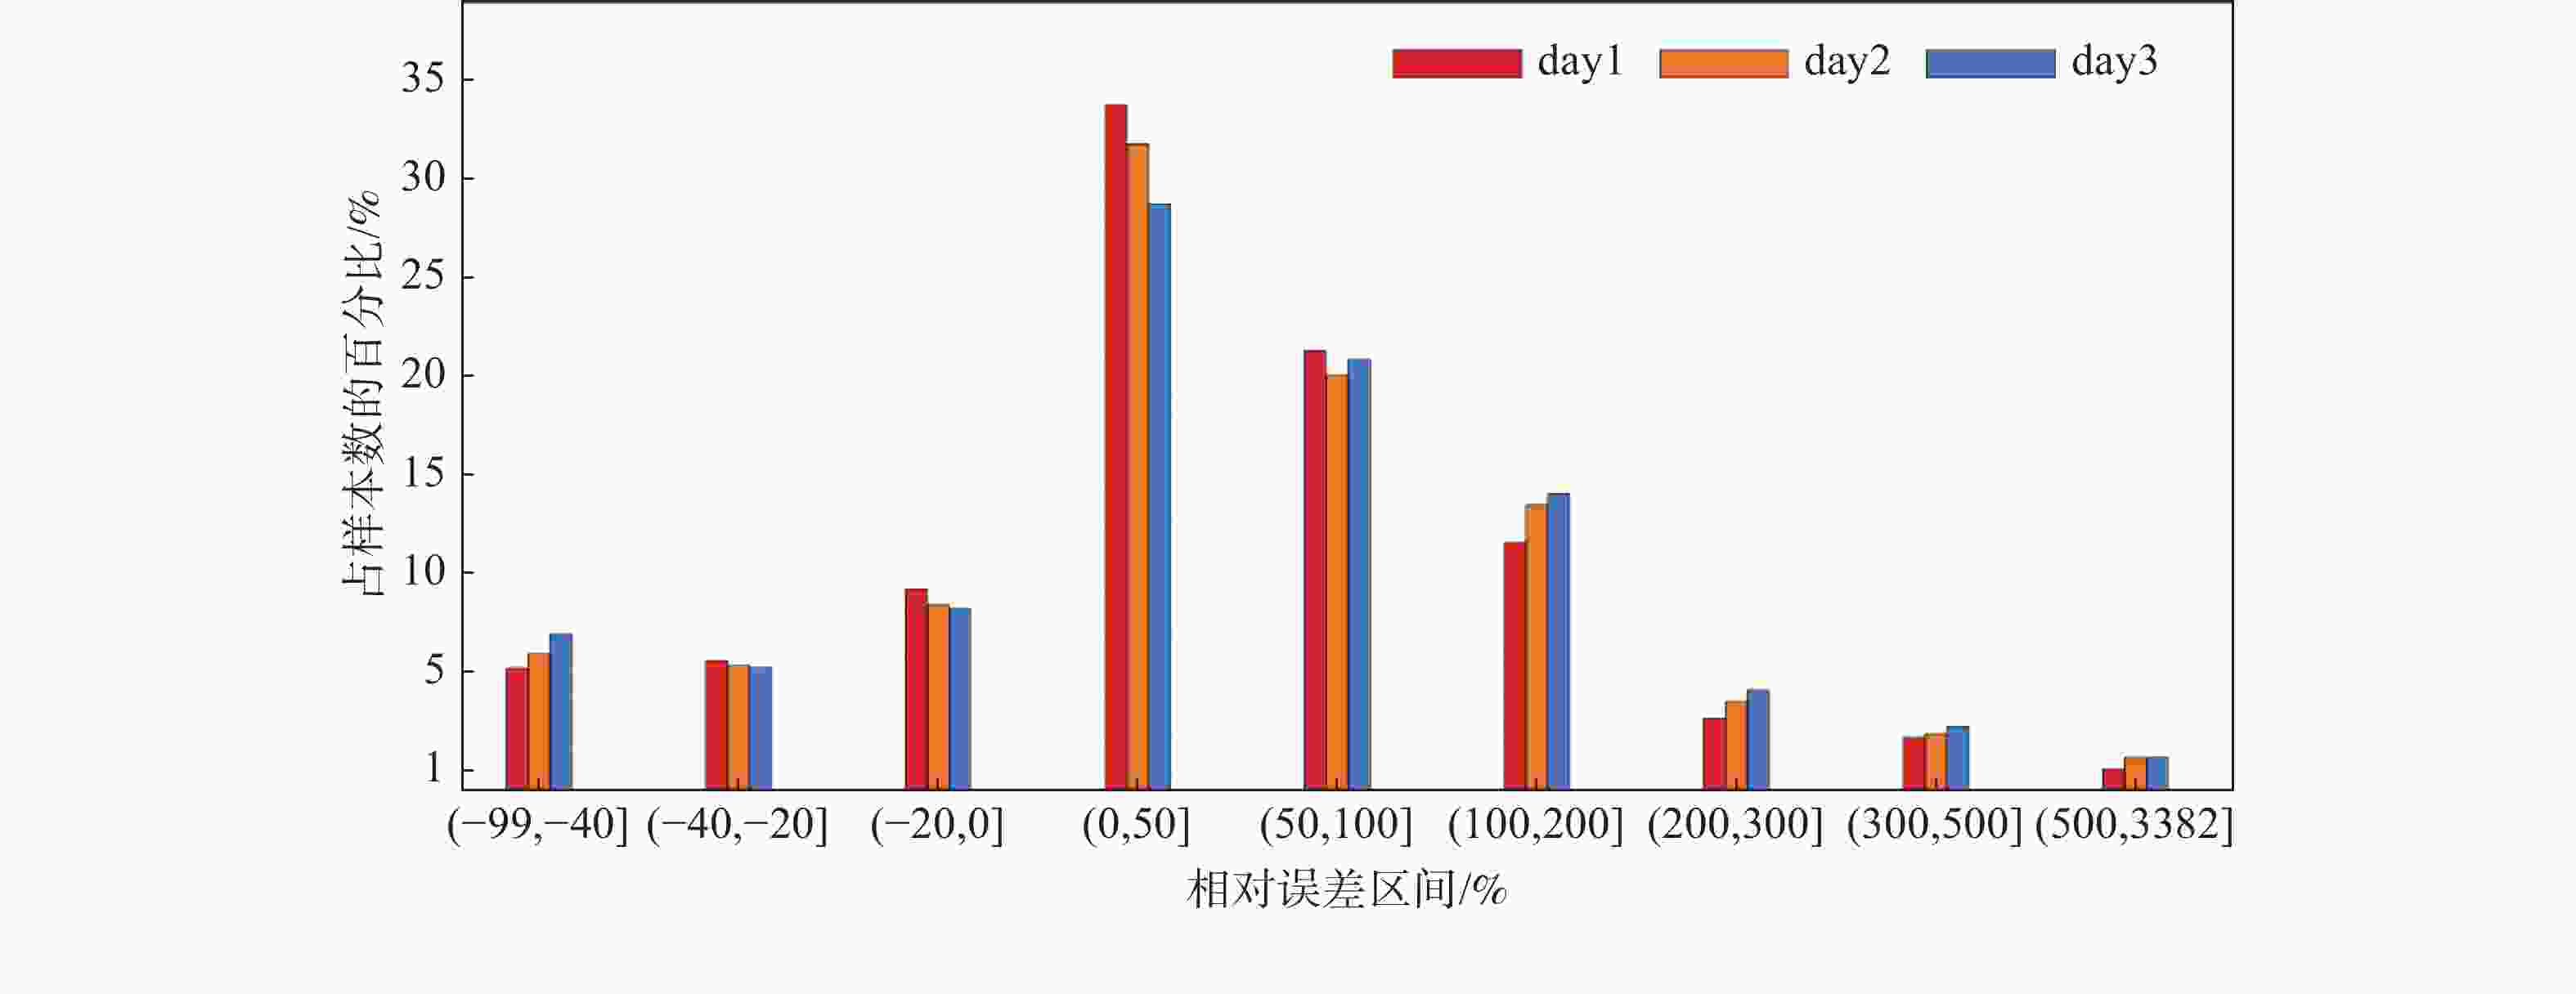
      Figure 5.  The distribution of relative errors between CMA-WSP forecast and the measured hourly average wind speed in Zaoyang wind farm

      图6所示,可以发现CMA-WSP预报与枣阳风电场实测小时平均风速和相对误差随时间变化(图6),CMA-WSP预报小时平均风速与实测风速变化趋势较为一致,数值整体偏高,均呈现白天(8~18时,北京时间,下同)风速低、晚上(19~7时)风速高的特征。第1 d预报数值在7~11时均高于第2 d和第3 d预报,其他时段低于后两天预报结果。MRE值在21%~60%之间波动,在1~9时MRE主降低,9时以后逐渐升高,9时MRE值最低,22时MRE值最高,除7~11时外,第1 d预报MRE值均低于后两天预报MRE值。

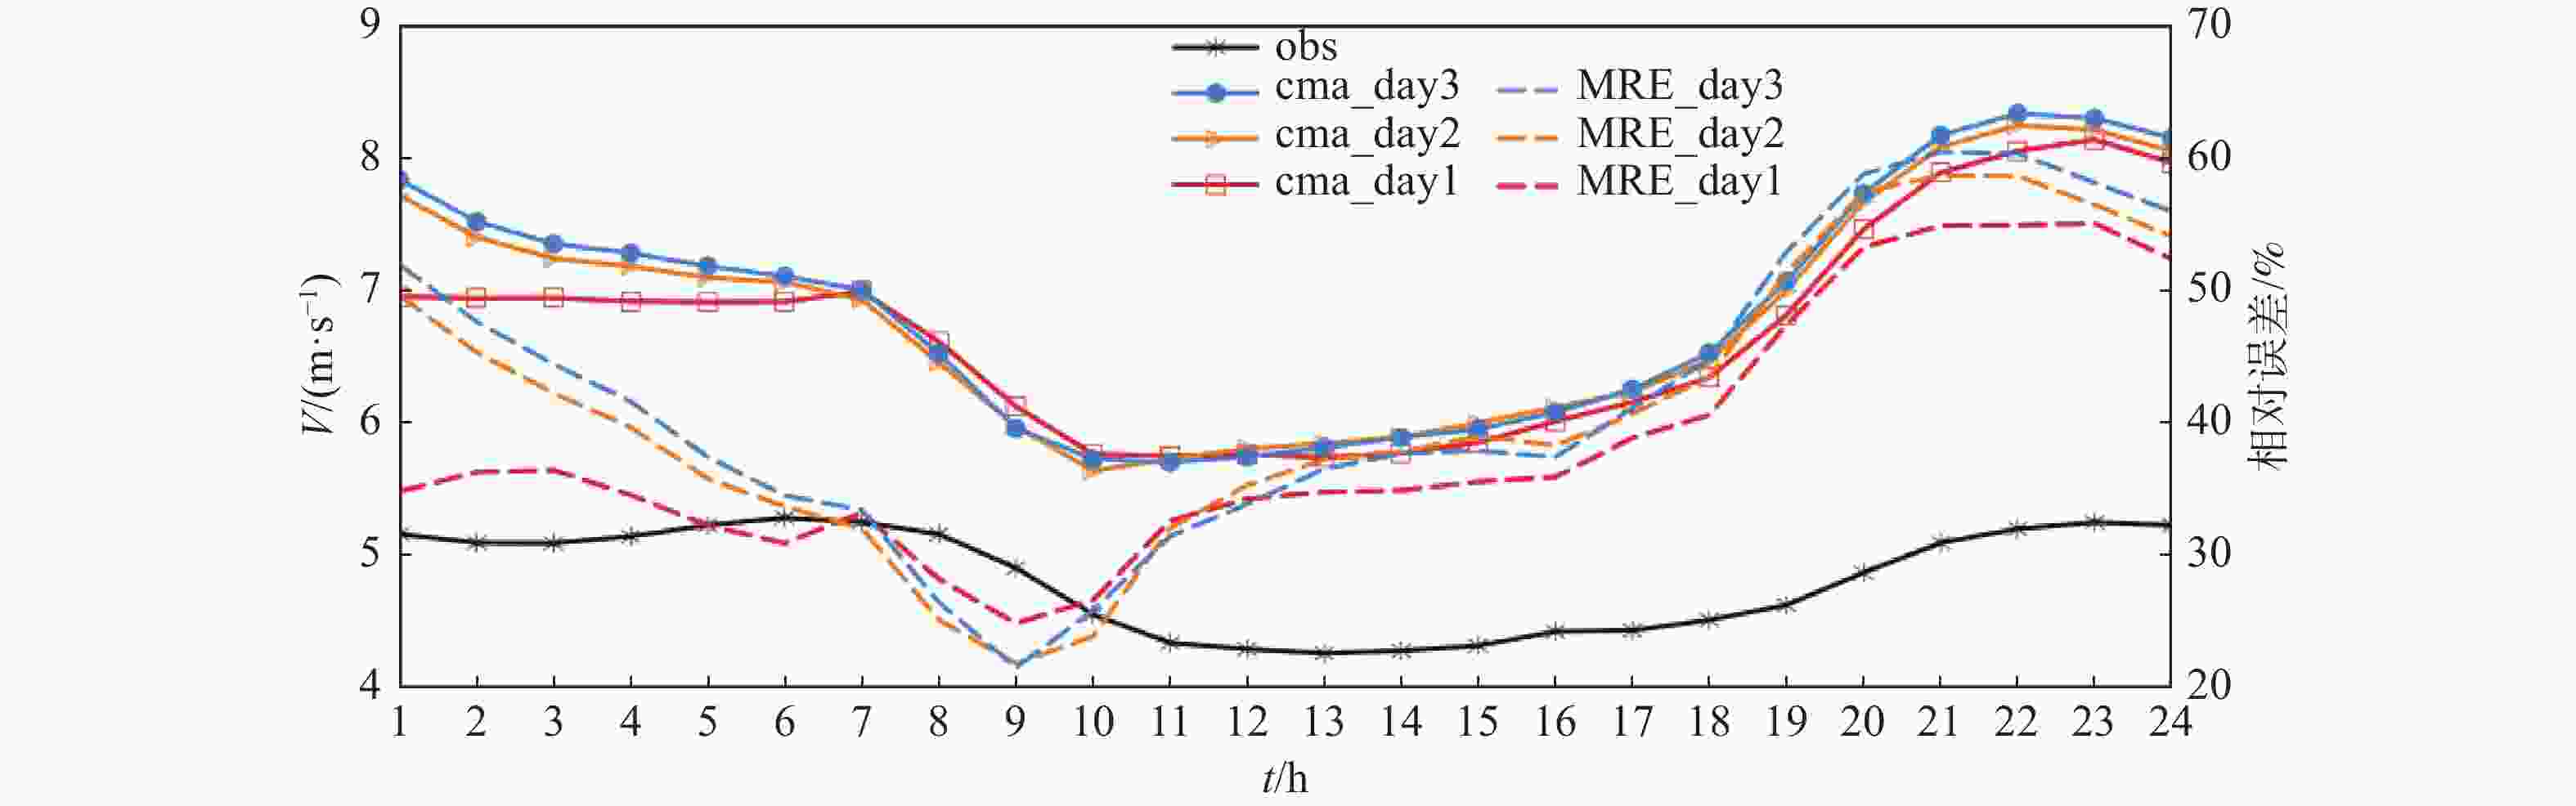
      Figure 6.  The variations over time of CMA-WSP forecast and the measured hourly average wind speed and relative error in Zaoyang wind farm
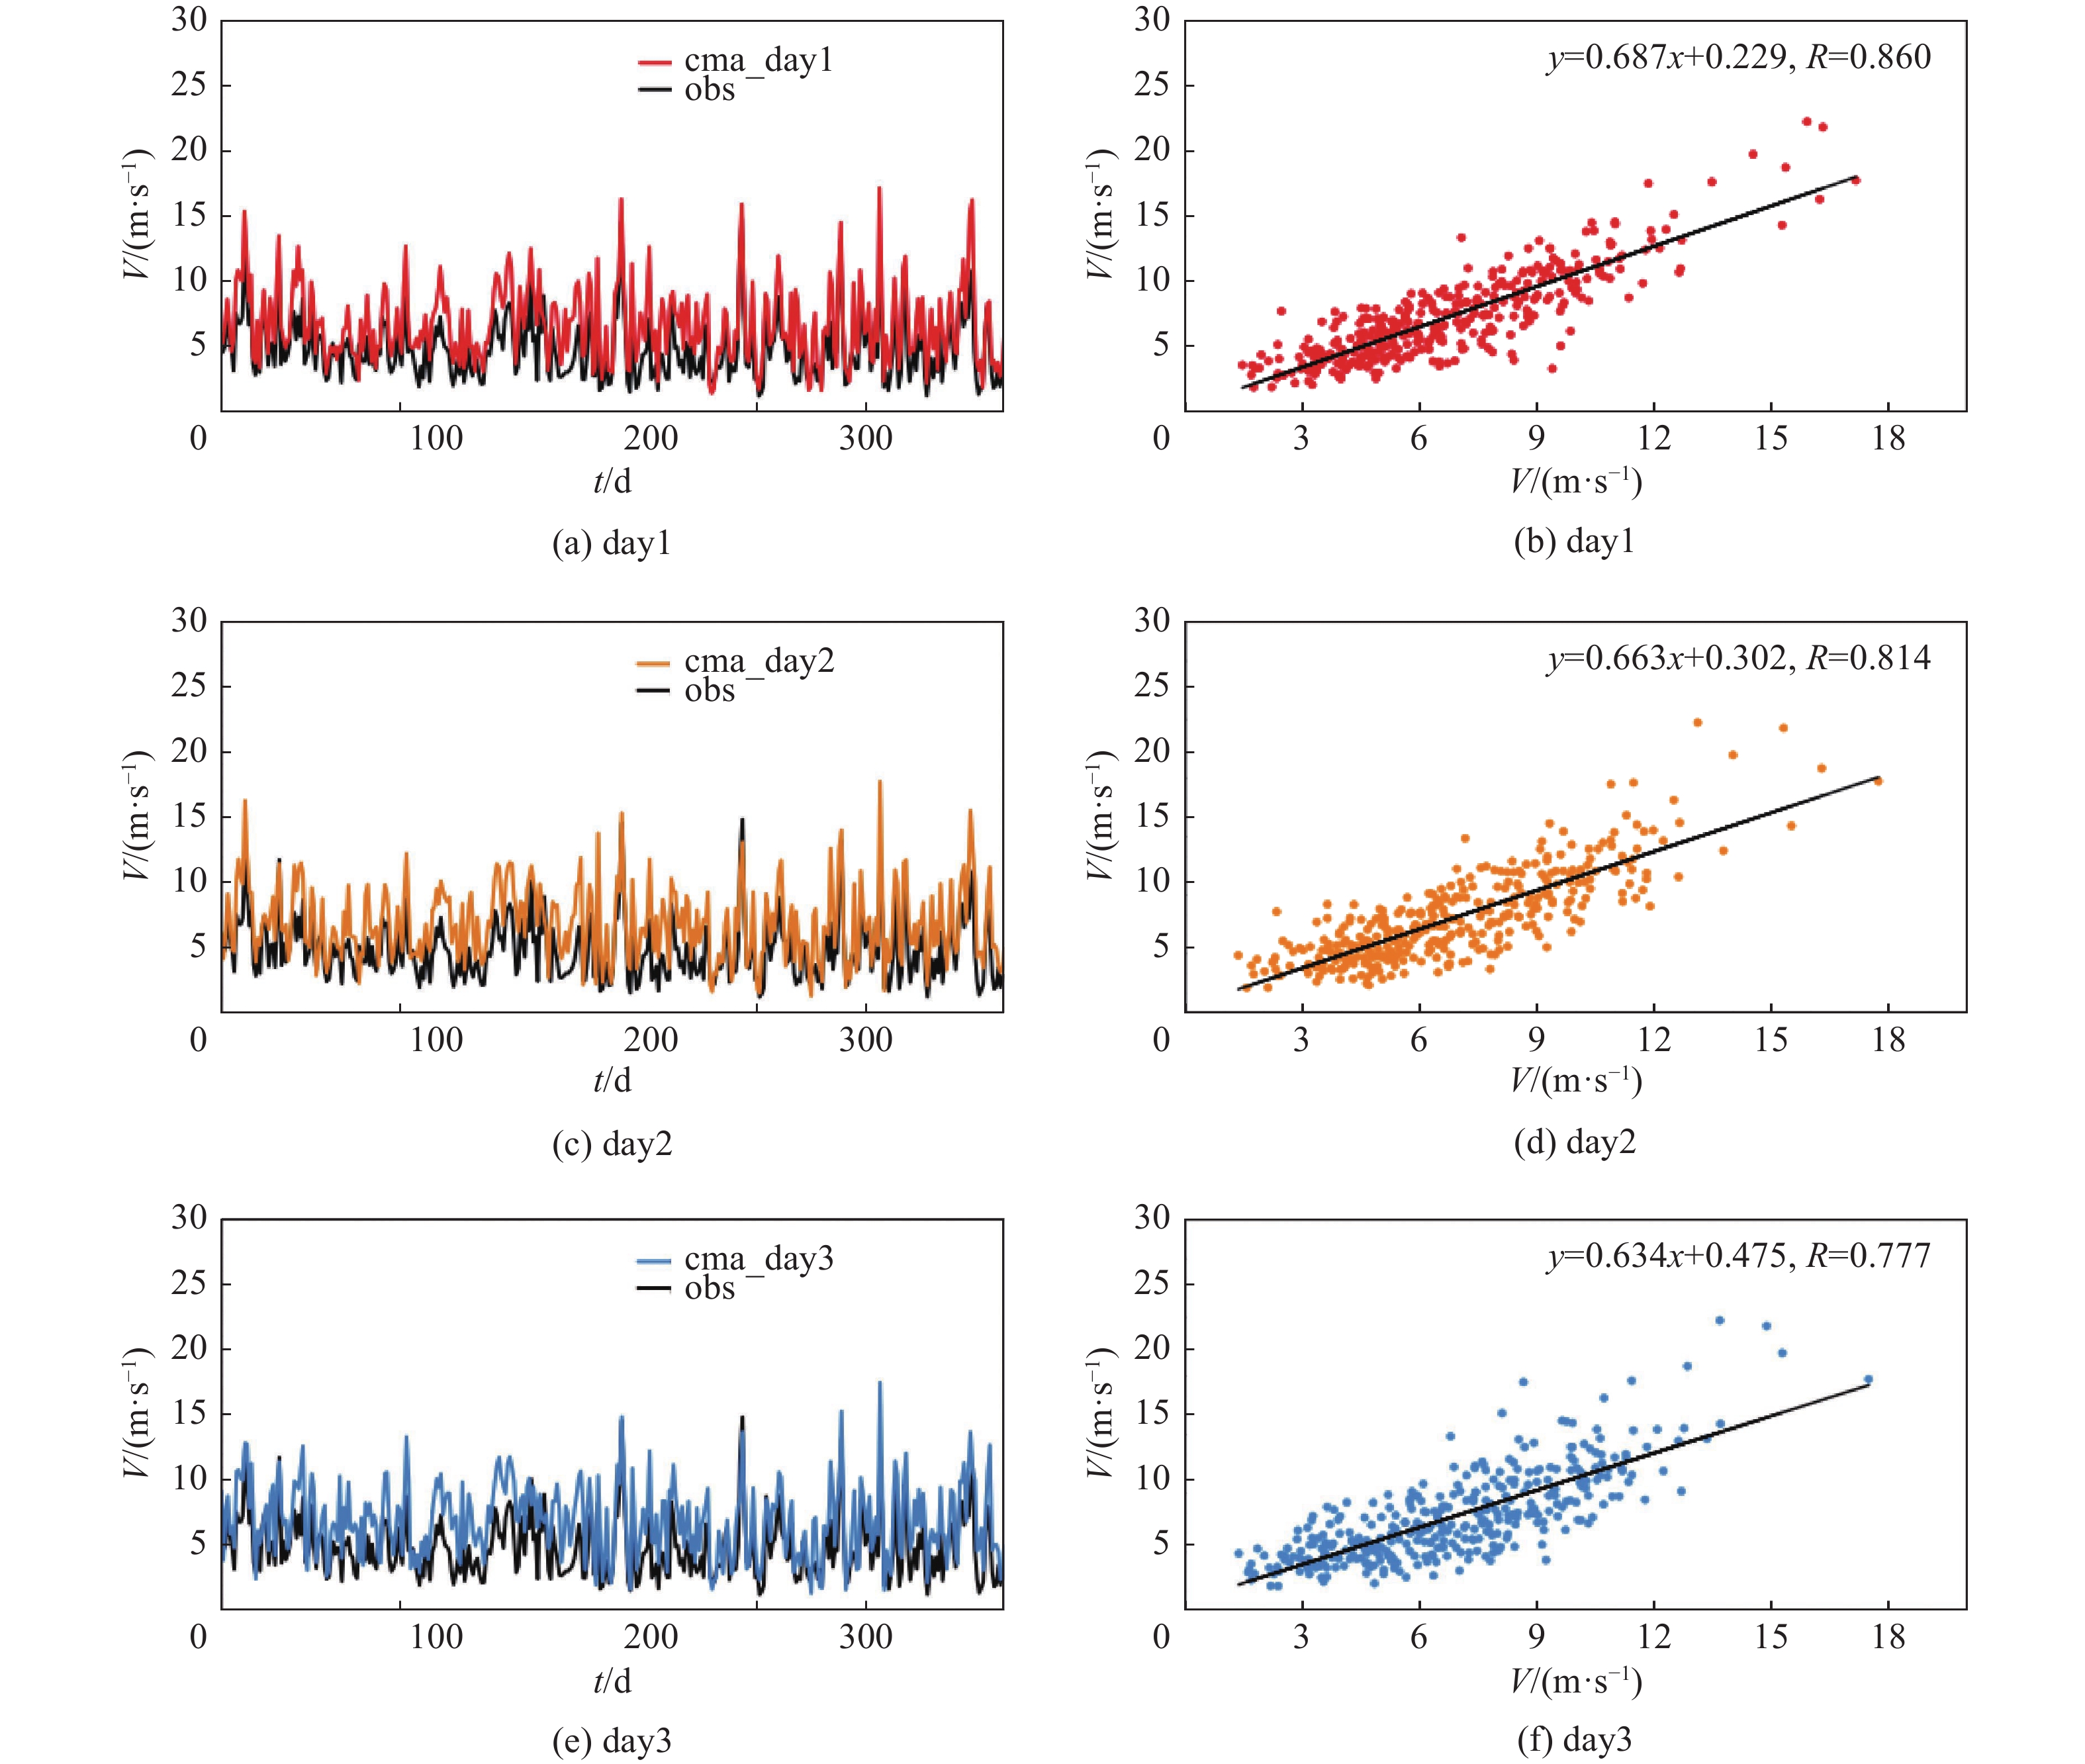
    • 图7所示,可以看到CMA-WSP前3 d预报与枣阳风电场实测日平均风速相关关系可以看到,前3 d预报风速与实测风速变化趋势较为一致,从数值上来看,第1 d预报日平均风速在1.49~17.15 m/s之间,第2 d预报日平均风速在1.35~17.72 m/s之间,第3 d预报日平均风速在1.38~17.47 m/s之间,实测日平均风速在1.27~14.83 m/s之间,可见CMA-WSP预报风速在数值上整体都高于实测风速。

      Figure 7.  The variations over time of CMA-WSP forecast and the measured daily average wind speed and relative error in Zaoyang wind farm

      从预报风速与实测风速的相关关系来看,第1 d预报的日平均风速与实测风速相关性达到0.860,第2 d预报的日平均风速与实测风速相关性为0.814,第3 d预报的日平均风速与实测风速相关性为0.777,可见,CMA-WSP前3 d风速效果较好,且随着预报时效增加预报效果降低。

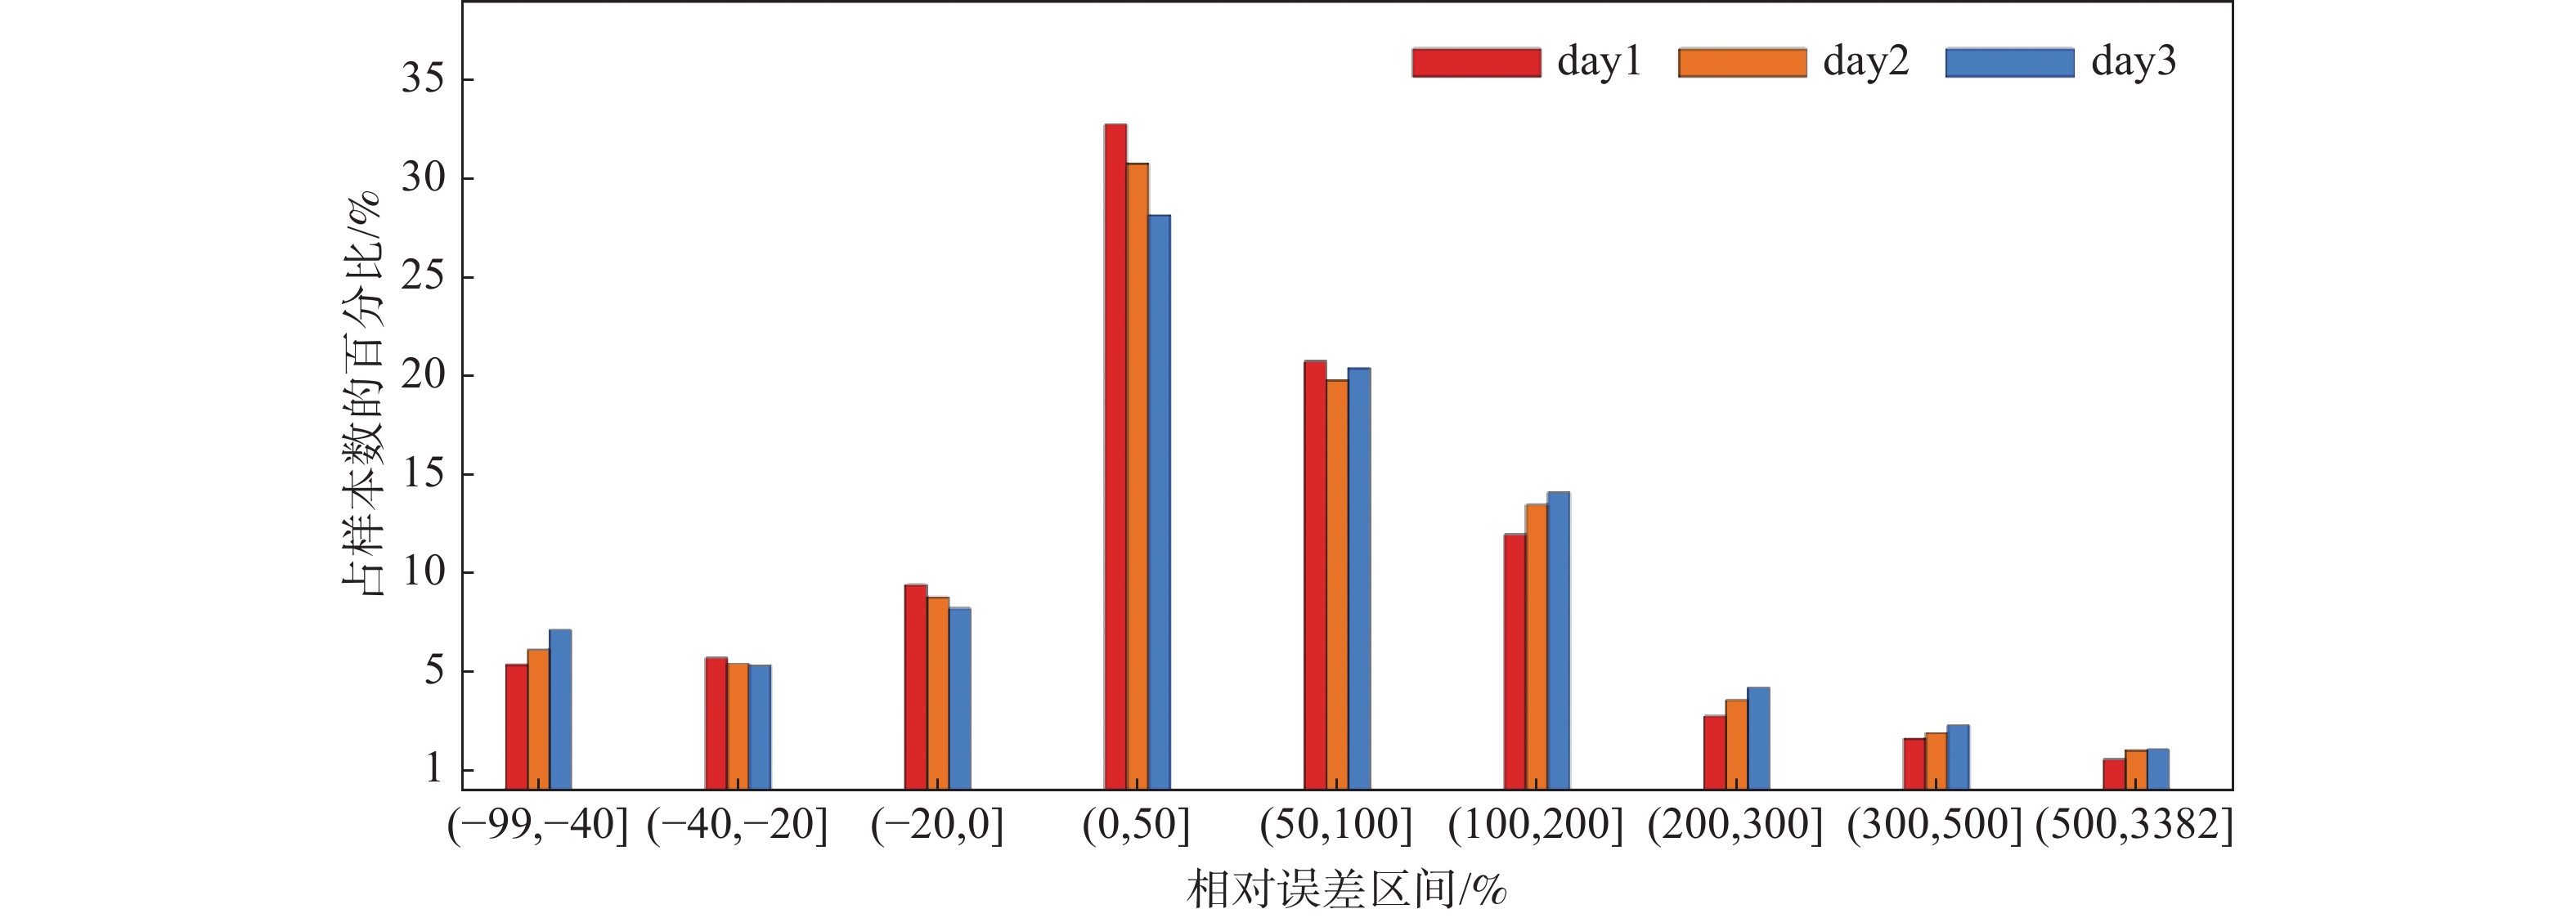
      从CMA-WSP 3 d预报与枣阳风电场实测日平均风速相对误差区间分布来看,MRE值主要集中在MRE值为200%的区间内,3 d预报数据MRE在200%以内的数据分别占92%、89%和85%。其中,分别有54%、47%、42%的数据MRE值集中在0%~50%之间,负偏差占比分别约为7%、9%和13%,预报比实测日平均风速数值总体偏高。此外,在MRE值为−40%~100%区间内,第1 d的预报日平均风速数据样本占比要高于第2 d和第3 d,说明第1 d预报风速的MRE整体要高于第2 d和第3 d,如图8所示。

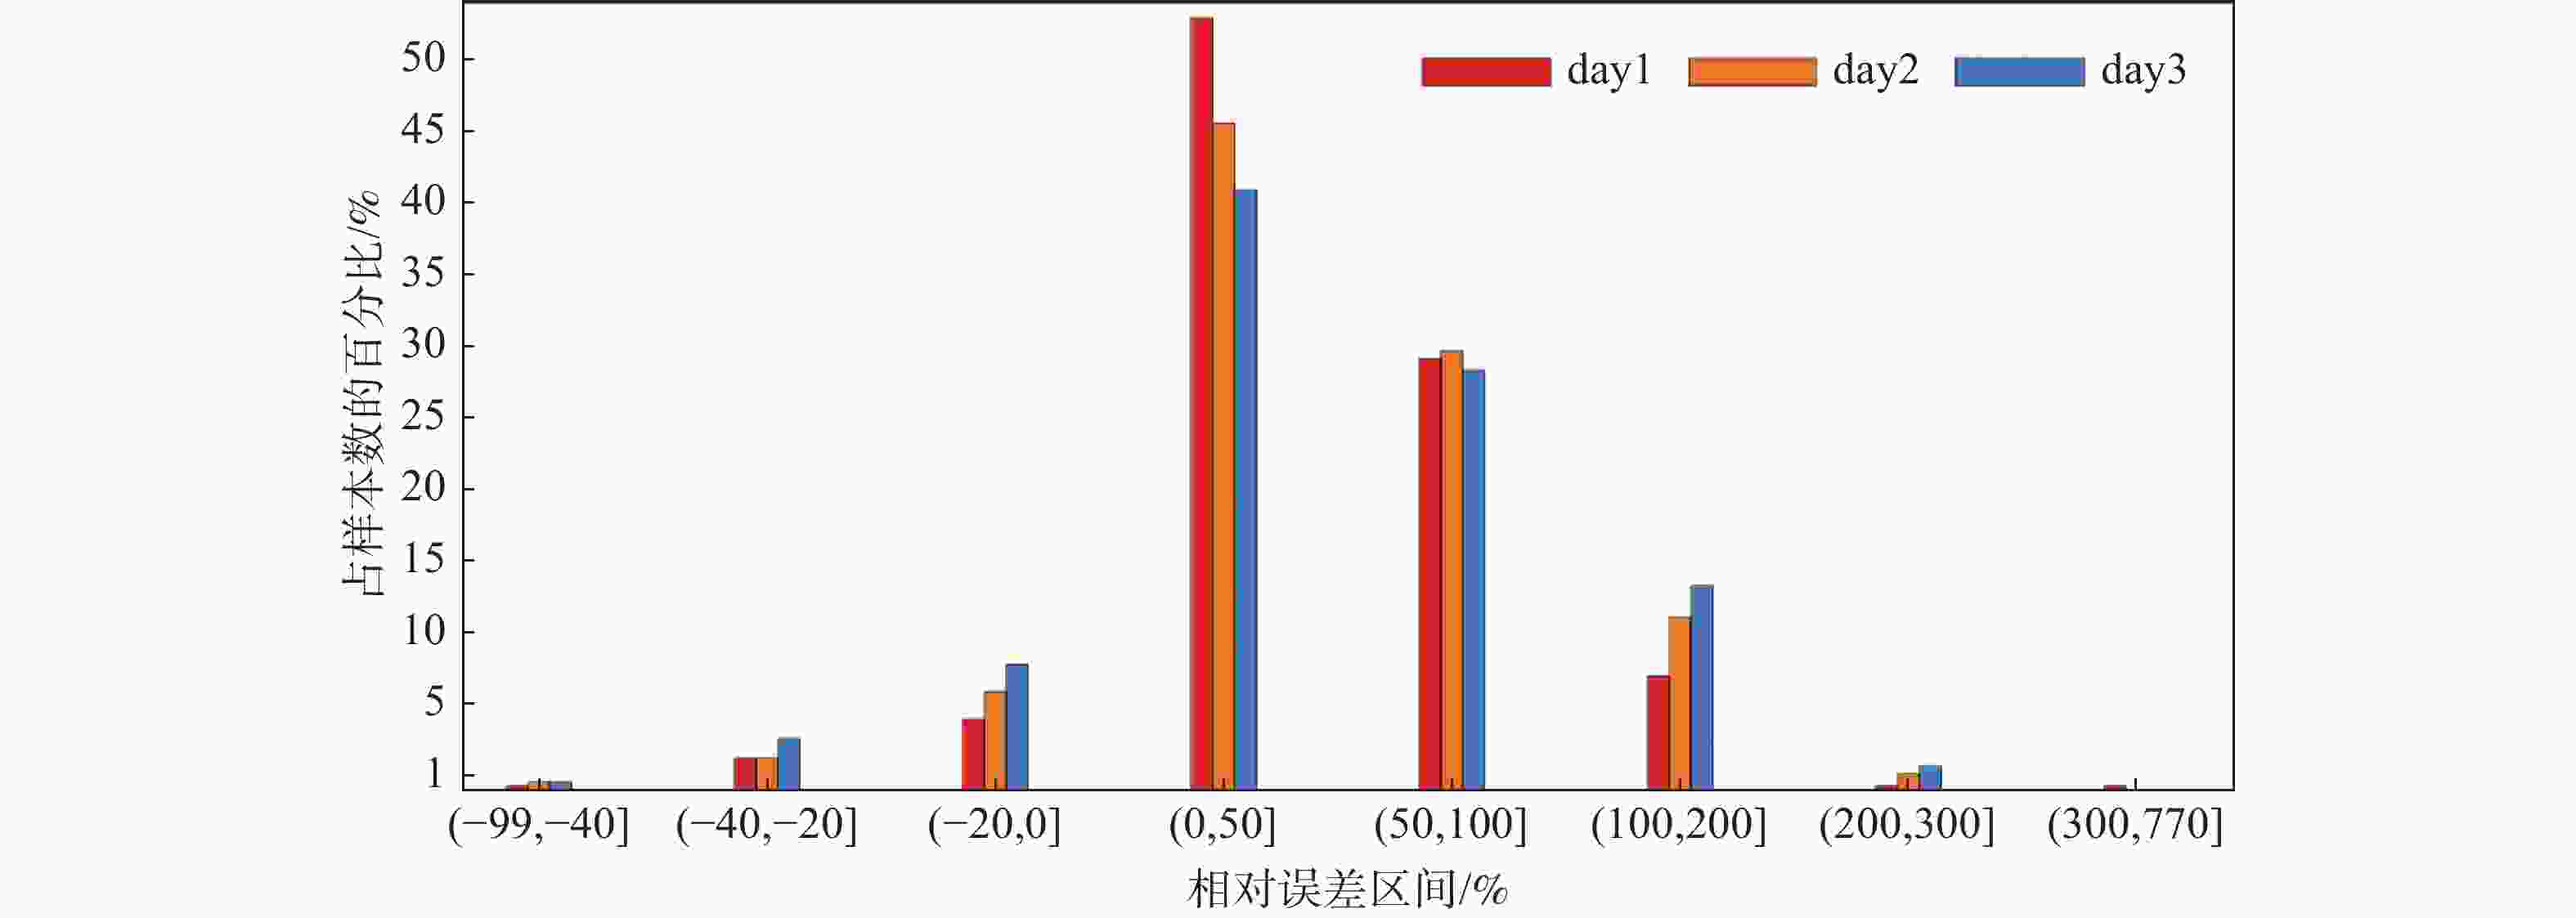
      Figure 8.  The distribution of relative errors between CMA-WSP forecast and the measured daily average wind speed in Zaoyang wind farm

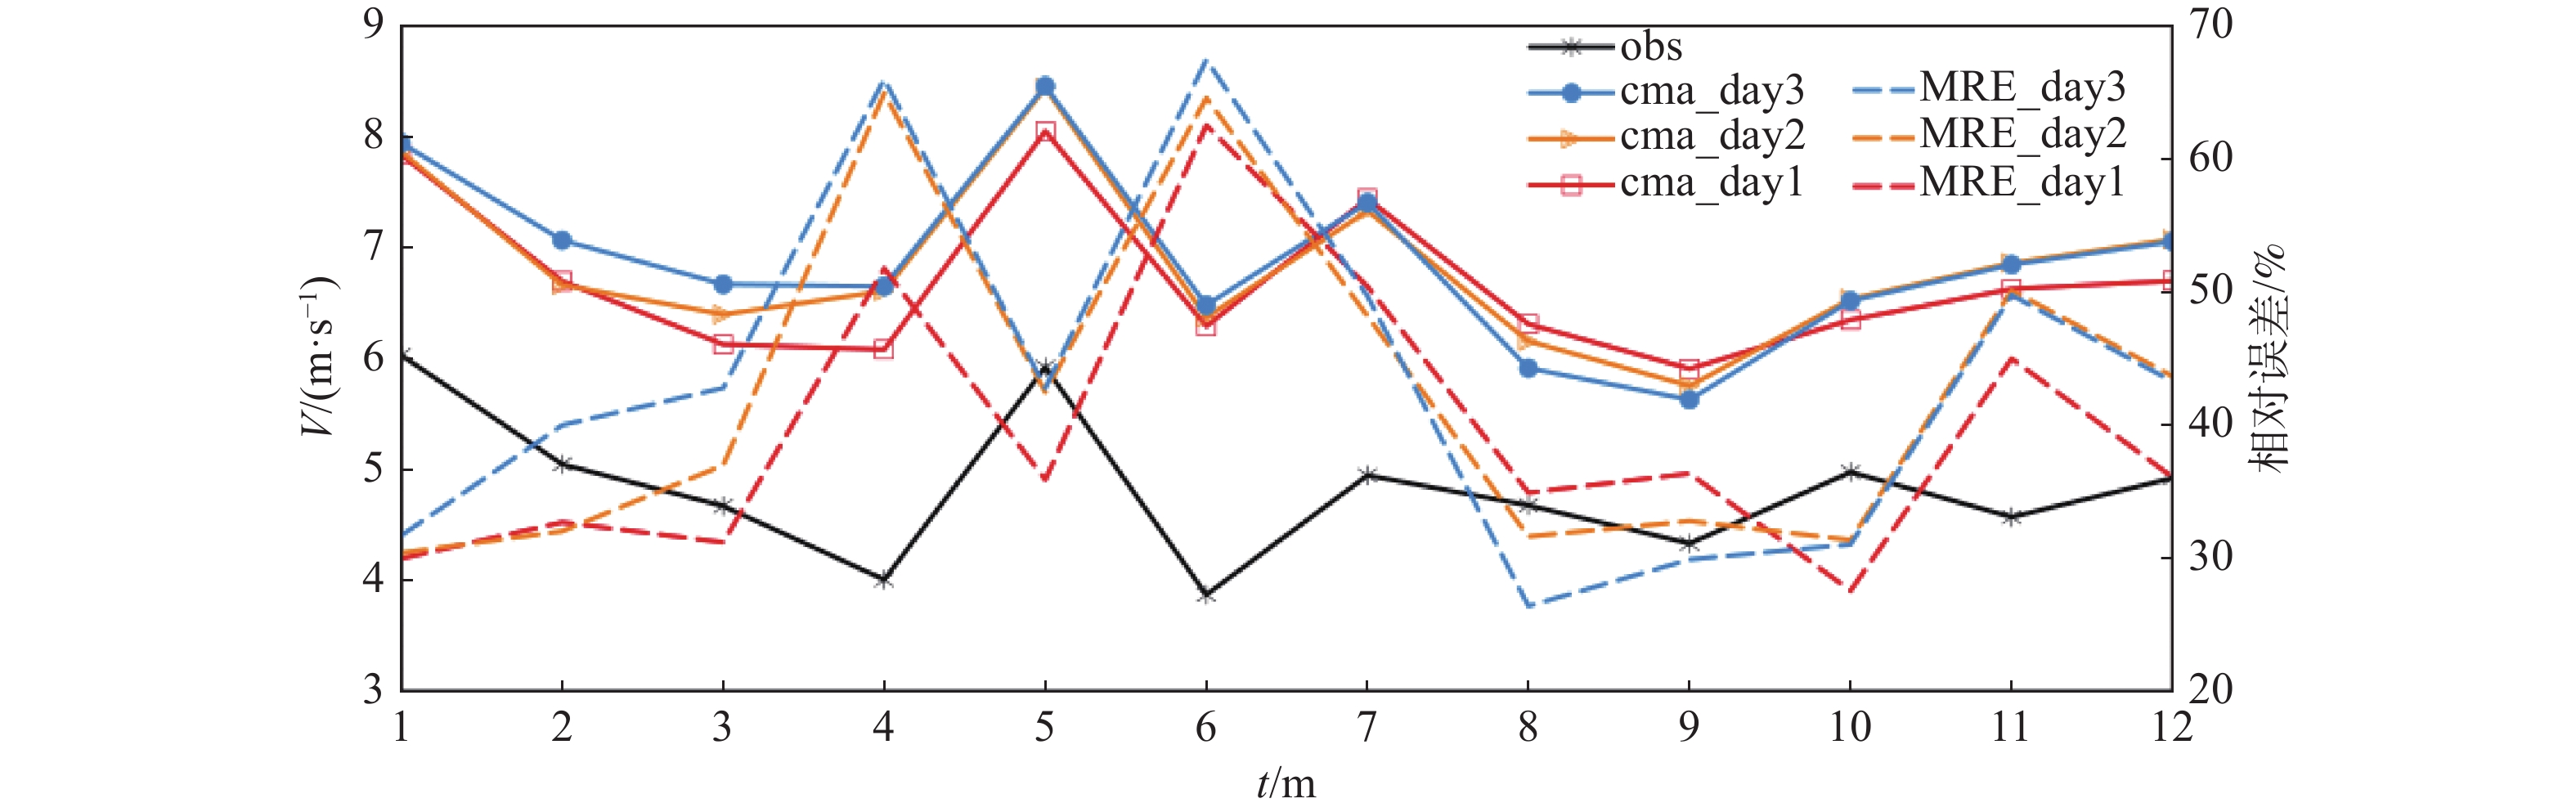
    • 从CMA-WSP预报月平均风速与枣阳风电场实测月平均风速和相对误差随时间变化可以看出,3 d预报与实测月平均风速变化趋势一致,从数值上来看,各月预报风速在5.9~8.0 m/s、5.7~8.4 m/s和5.6~8.4 m/s之间波动,整体要高于实测月平均风速3.8~6.0 m/s。从预报月平均风速与实测月平均风速的MRE值变化来看,MRE值在25%~68%之间变化,最大值出现在6月份,最小值出现在8月份。从不同预报时效来看,第1天预报MRE值在1~6月和10~12月最低,在7~9月最大。此外,从月平均风速和MRE值变化趋势可以看到,风速与MRE值变化呈相反趋势,即月平均风速越大,MRE越小,如图9所示。

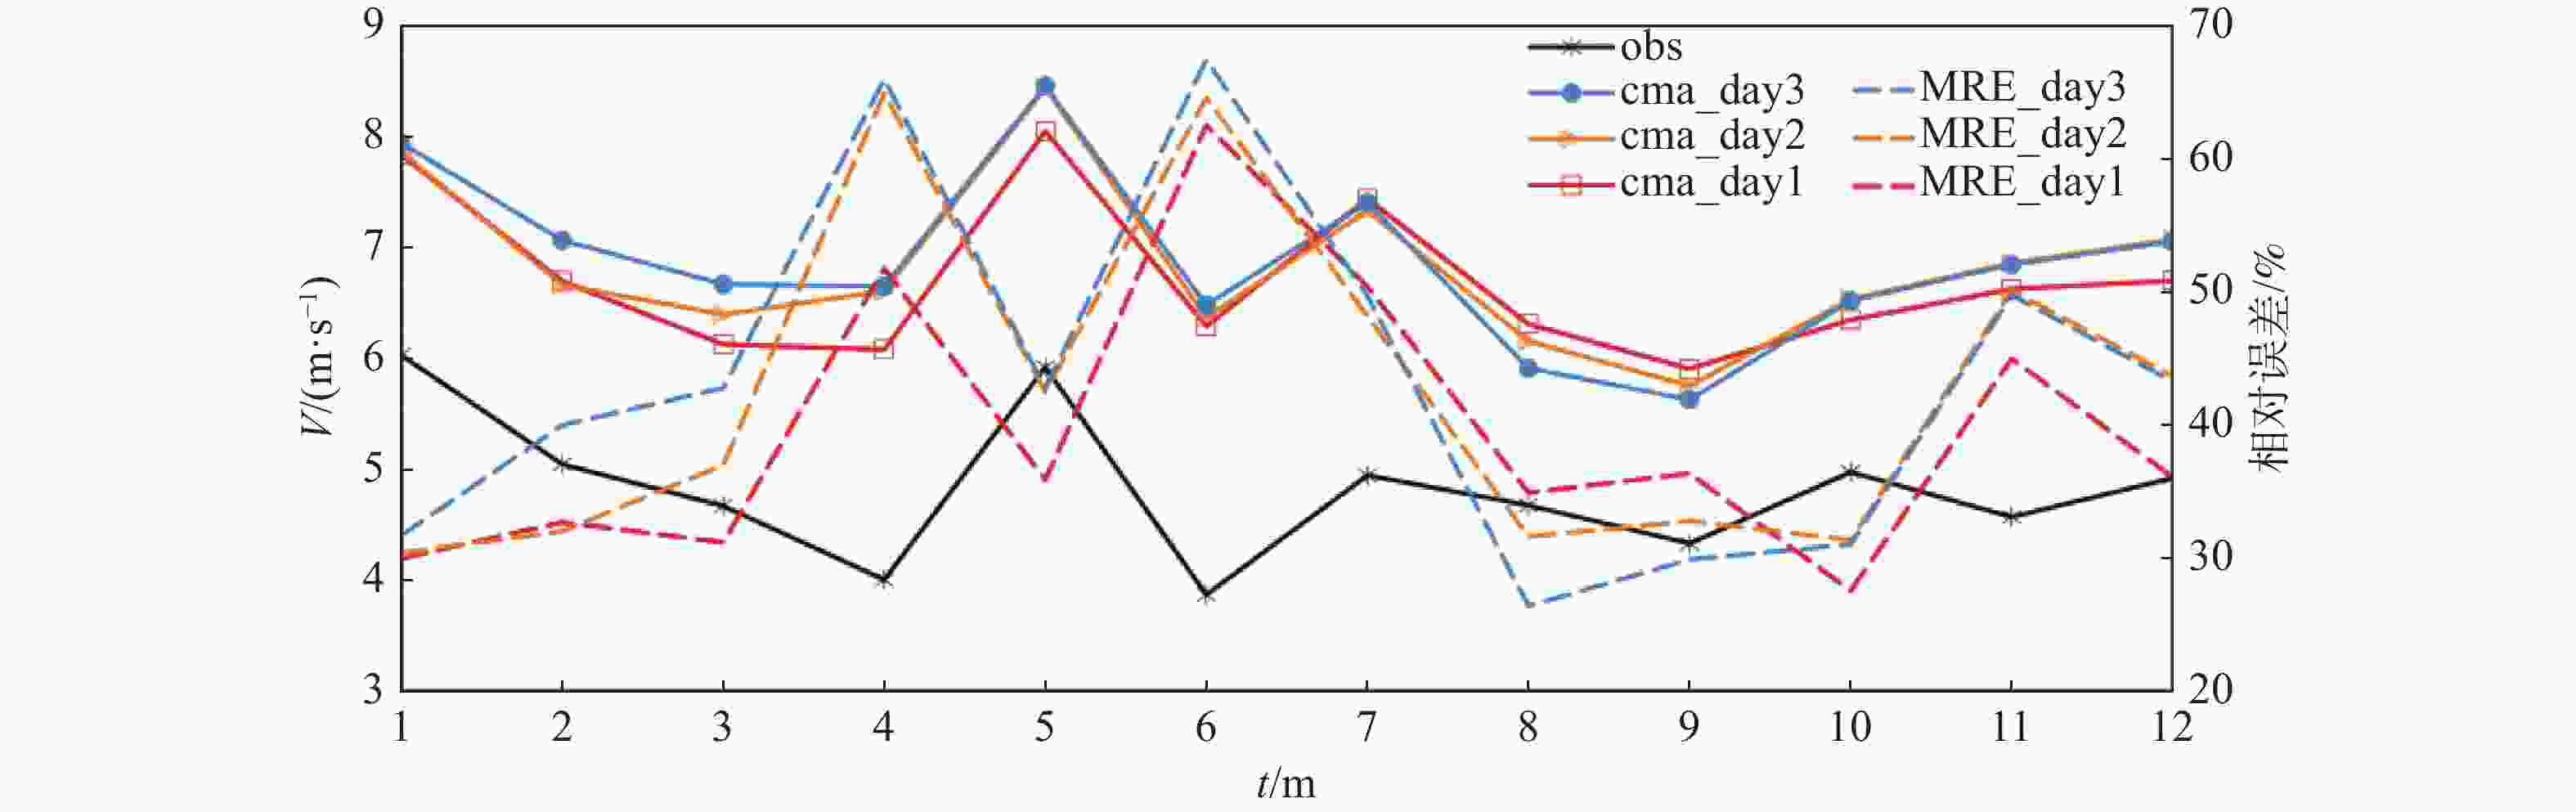
      Figure 9.  The variations over time of CMA-WSP forecast and the measured monthly average wind speed and relative error in Zaoyang wind farm

    • 上述章节对枣阳风电场站和CMA-WSP预报风速的相关性和误差分布特征进行了详细地分析。表1给出了枣阳周楼、蔡家寨和大金中部风电场实测风速与CMA-WSP预报风速的相关性、均方根误差、平均偏差和平均绝对偏差的统计值。通过统计发现,CMA-WSP在不同区域的风速预报存在较大的差异。

      站点预报时效相关系数均方根误
      差/(m·s−1)
      平均偏差/
      (m·s−1)
      平均绝对偏
      差/(m·s−1)
      枣阳第1 d0.7283.1601.8682.492
      第2 d0.6743.3872.0042.682
      第3 d0.6383.5122.0532.826
      蔡家寨第1 d0.5482.771−0.0092.187
      第2 d0.5002.907−0.0272.280
      第3 d0.4343.0420.1002.400
      大金中部第1 d0.3623.2041.1522.430
      第2 d0.3393.1271.0962.403
      第3 d0.3063.1611.0402.455

      Table 1.  Evaluation index of CMA-WSP forecast and the measured wind speed in Zaoyang, Caijiazhai and Central Dajin wind farms

      从预报与实测风速的相关性来看,CMA-WSP对枣阳周楼风电场的风速预报效果最好,前3 d预报风速与实测风速的相关系数分别为0.728、0.674和0.638,蔡家寨前3 d的预报风速与实测风速相关系数分别为0.548、0.500和0.434,大金中部前3 d的预报风速与实测风速相关系数分别为0.362、0.339和0.306,预报效果最差。

      从均方根误差来看,枣阳风电场前3 d预报风速与实测风速均方根误差最大,分别为3.316 m/s、3.387 m/s、3.512 m/s,蔡家寨风电场前3 d预报风速与实测风速均方根误差最小,分别为2.771 m/s、2.907 m/s、3.042 m/s,大金中部风电场前3 d预报风速与实测风速均方根居中,分别为3.204 m/s、3.127 m/s、3.161 m/s。从平均偏差和平均绝对偏差来看,枣阳风电场前3 d预报风速与实测风速的平均偏差和平均绝对偏差均最大,其中,平均偏差分别为1.868 m/s、2.004 m/s、2.053 m/s,平均绝对偏差分别为2.492 m/s、2.682 m/s、2.826 m/s;蔡家寨风电场前3 d预报风速与实测风速的平均偏差和平均绝对偏差均最小,其中,平均偏差分别为−0.009 m/s、−0.027 m/s、0.100 m/s,平均绝对偏差分别为2.187 m/s、2.280 m/s、2.400 m/s;大金中部风电场前3 d预报风速与实测风速的平均偏差和平均绝对偏差居中,其中平均偏差分别为1.152 m/s、1.096 m/s、1.040 m/s,平均绝对偏差分别为2.430 m/s、2.403 m/s、2.455 m/s。枣阳风电场处的CMA-WSP预报风速和实测风速的均方根误差、平均偏差和绝对误差较蔡家寨和大金中部风电场都大,这可能与检验的数据量有关,蔡家寨和大金中部风电场风速数据缺测较多,而枣阳风电场实测风速数据相对完整。

      总体而言,CMA-WSP对枣阳风电场风速的预报效果较好,其中,第1 d预报与实测风速相关系数可以达到0.728,第2~3 d也超过了0.6,CMA-WSP对蔡家寨和大金中部风电场预报风速与实测风速相关系数均低于0.6,但都通过了置信度区间为95%的显著性检验。均方根误差、平均偏差和平均绝对偏差的统计结果显示,风速的预报与实测风速存在较大的偏差,如图2所示,预报风速整体较实测风速偏大,可见模式对风速的预报存在明显的系统性偏差。近地层风速高时空分辨率预报一般依赖数值天气预报模式,模式通常采用参数化的方法,但参数化方案通常是不完善的,这是造成数值模式不能准确预报近地层风场的原因之一;模式地形与实际地形存在不同程度的差异,即使同一个模式,不同地形地貌也会表现出不同的预报性能[23-24],本文所选取的3个风电场站均为丘陵,下垫面状况比较复杂且各不相同,因此,CMA-WSP模式对风速的预报在枣阳周楼、麻城蔡家寨和大金中部风电场的预报存在较大的差异。

    • 以湖北枣阳周楼、麻城蔡家寨和大金中部3个风电场为代表,对中国气象局风能太阳能模式(CMA-WSP)的100 m风速3 d预报产品在风资源短期预报中的应用效果开展了检验评估,主要结论如下:

      1)CMA-WSP对枣阳风电场风速预报与实测风速变化趋势较为一致,逐15 min、小时平均和日平均风速第1 d的预报与实测风速相关性可达0.728、0.740和0.860,随着预报时效增加,预报与实测相关性逐渐降低,但整体预报效果均较好。

      2)CMA-WSP预报风速与实测风速的MRE值主要集中在200%以内的区间,逐15 min、小时平均和日平均风速第1 d预报的MRE值分别为68%、70%、92%,数值上预报风速整体高于实测风速。小时平均风速及MRE值均呈现白天小、晚上大的特征,月平均风速变化与MRE值变化呈相反趋势,MRE值在1~6月和10~12月最低、7~9月最大。

      3)CMA-WSP对枣阳风电场风速的预报效果最好。其中,第1 d预报与实测风速相关性可以达到0.728,第2~3 d的预报相关性也超过了0.6,CMA-WSP对蔡家寨和大金中部预报风速与实测风速相关性均低于0.6。从均方根误差、平均相对偏差和绝对偏差来看,CMA-WSP对枣阳风速预报显著高于对蔡家寨和大金中部。

      本文选取了3个风电场的实测风速对CMA-WSP预报风速开展了误差统计和分析工作,要想对该模式预报产品进行全面评估和应用,还需要获取更多场站的实测风速资料,对更长时间序列以及预报时效的风速预报产品开展检验。为了使该预报产品应用到专业气象服务中,需要对该产品进行订正,为日后进行风速预报产品的使用提供科学依据。

Reference (24)

Catalog

    /

    DownLoad:  Full-Size Img  PowerPoint
    Return
    Return