• Peer Review
  • Non-profit
  • Global Open Access
  • Green Channel for Rising Stars
Volume 1 Issue 1
Jul.  2020
Turn off MathJax
Article Contents

Wenjie ZHENG, Xiaojun CHEN, Bo LI, Shu HUANG. Practical Research on Graph and Model Exchange Between GIS and Distribution Automation System[J]. SOUTHERN ENERGY CONSTRUCTION, 2014, 1(1): 34-37. doi: 10.16516/j.gedi.issn2095-8676.2014.01.006
Citation: Wenjie ZHENG, Xiaojun CHEN, Bo LI, Shu HUANG. Practical Research on Graph and Model Exchange Between GIS and Distribution Automation System[J]. SOUTHERN ENERGY CONSTRUCTION, 2014, 1(1): 34-37. doi: 10.16516/j.gedi.issn2095-8676.2014.01.006

Practical Research on Graph and Model Exchange Between GIS and Distribution Automation System

doi: 10.16516/j.gedi.issn2095-8676.2014.01.006
  • Received Date: 2014-10-01
  • Publish Date: 2014-12-25
  • At present, the graphics modules' automatic export from geographic information system(GIS) and import to distribution automation systems (DAS)are not solved in most of the new local power supply bureaus. Data quality is the most common problem found in the data model between the export from GIS and the import to DAS. The graph and model exchange cannot be finished in an automatic manner while DAS does not have unified graphic primitives and the graphics appears to be misplaced after importing SVG graphics from GIS. Workflows for graph and model exchange between GIS and DAS have been discussed and established in many power supply bureaus of Guangdong Power Grid. Provided that the correspondent department and personel have been assigned, the process still needs to be strengthened and so does the automation level. This paper presents the problem of model in GIS and graphics after deriving from GIS and importing to DAS. Suggestions and the corresponding countermeasures are also provided . The results show that the enterprise application integration will be further improved by considering the practical research on graph and model exchange between GIS and DAS with the optimization of management process.
  • [1] LIN Wu, ZHAO Jinghu, DU Hongwei, et al., Distribution Management Systems based on Standard IEC 61968[C]//2006 China International Conference on Electricity Distribution, Beijing: [S.n.],2006: 135-140.
    [2] WUERGLER E, VANHEMELRYK C. DMS, GIS and Planning Data Integration in a Distribution Utility Using IEC 61970 CIM[C]//22nd International Conference on Electricity Distribution, Stockholm: [S.n.],2013: 516-519.
    [3] NEUVILLE B D, SOMMEREYNS P. DMS, SCADA and GIS Interactions Redesigned while Renewing the GIS Legacy System[C]//19th International Conference on Electricity Distribution. Vienna: [S.n.],2007:130-134.
    [4] ART Bell. Use of GIS Information in a Utility Distribution Management System [EB/OL]. [1998-10-09]. http://proceedings.esri.com/library/userconf/europroc98/proc/idp99.html.
  • 通讯作者: 陈斌, bchen63@163.com
    • 1. 

      沈阳化工大学材料科学与工程学院 沈阳 110142

    1. 本站搜索
    2. 百度学术搜索
    3. 万方数据库搜索
    4. CNKI搜索

Figures(2)

Article Metrics

Article views(338) PDF downloads(36) Cited by()

Related

Practical Research on Graph and Model Exchange Between GIS and Distribution Automation System

doi: 10.16516/j.gedi.issn2095-8676.2014.01.006

Abstract: At present, the graphics modules' automatic export from geographic information system(GIS) and import to distribution automation systems (DAS)are not solved in most of the new local power supply bureaus. Data quality is the most common problem found in the data model between the export from GIS and the import to DAS. The graph and model exchange cannot be finished in an automatic manner while DAS does not have unified graphic primitives and the graphics appears to be misplaced after importing SVG graphics from GIS. Workflows for graph and model exchange between GIS and DAS have been discussed and established in many power supply bureaus of Guangdong Power Grid. Provided that the correspondent department and personel have been assigned, the process still needs to be strengthened and so does the automation level. This paper presents the problem of model in GIS and graphics after deriving from GIS and importing to DAS. Suggestions and the corresponding countermeasures are also provided . The results show that the enterprise application integration will be further improved by considering the practical research on graph and model exchange between GIS and DAS with the optimization of management process.

Wenjie ZHENG, Xiaojun CHEN, Bo LI, Shu HUANG. Practical Research on Graph and Model Exchange Between GIS and Distribution Automation System[J]. SOUTHERN ENERGY CONSTRUCTION, 2014, 1(1): 34-37. doi: 10.16516/j.gedi.issn2095-8676.2014.01.006
Citation: Wenjie ZHENG, Xiaojun CHEN, Bo LI, Shu HUANG. Practical Research on Graph and Model Exchange Between GIS and Distribution Automation System[J]. SOUTHERN ENERGY CONSTRUCTION, 2014, 1(1): 34-37. doi: 10.16516/j.gedi.issn2095-8676.2014.01.006
  • 在广东电网的大部分城市以及农村地区,配电网的电压等级为10 kV。早期,配网工程师主要依靠图纸来进行配网调度以及作为运行维护的参考,很多时候完全依靠经验来进行操作。

    随着地理信息系统(GIS)的引入,能够在系统里面生成沿布图来表征网络的走向,以及用单线图来辅助系统调度员对网络进行调度运行管理。

    后来进一步发展了配电管理系统,基于IEC61970 CIM标准进行建模,覆盖了配电网的所有设备与网络[1-2]。配电管理系统由基础平台,SCADA功能及众多的高级应用软件组成。SCADA负责接收实时的遥测及遥信等信号及量测量,在屏幕上展示给系统调度员。另外,还在各县区供电局部署WEB页面浏览功能,通过只读的权限给县区局调度人员展示系统的信息。

    网络连接模型描述了所有配电设备及网络的状态、属性以及关联关系。网络拓扑支撑配电管理系统中的高级应用,配电管理系统的输出通过屏幕来显示。网络的拓扑关系及沿布图,通过在线的GIS-DMS接口来获得,这样可以大大降低运维成本与提高运营效率[3-4]

    用来实现DMS-GIS接口的最快的方法莫过于建立一个可以每天通过XML文件进行更新的自动化接口。考虑到GIS与DMS通常由不同的厂商开发,各个厂家对模型的理解不尽相同,尽管已经有IEC的相关标准以及我国的国家标准。

    本文对近来开展DMS-GIS图模导入导出接口工作进行的描述,包括单线图的导入与转换问题等。

  • 鉴于不同地区的发展的差异,并非所有的地区供电局都有配网自动化系统。另一方面,所有的供电局均装有能量管理系统,用来对主网进行运行调度管理。因此,配网单线图的绘制既可以在配网自动化里面实现,也可以在EMS里面进行功能扩充实现。

  • 导出的SVG图形要保证和配网GIS图形一致,不允许因坐标误差而导致设备与设备之间的连接关系断开或者有偏离,并保证忠实原图。

    SVG图形必须具备以下几层信息:

    <g id=”background”>

    <g id=”Circuit_Layer”>

    <g id=”Substation_Layer”>

    <g id=”Break_Layer”>

    <g id=”LoadBreakSwitch_Layer”>

    <g id=”Disconnector_Layer”>

    <g id=”GroundDisconnector_Layer”>

    <g id=”PowerTransformer_Layer ”>

    <g id=”ACLineSegment_Layer ”>

    <g id=”BusbarSection_Layer ”>

    <g id=”FaultIndicator_Layer”>

    <g id=”ConnectLine_Layer”>

    <g id=”Text_Layer”>

    <g id=”TermMeasure_Layer”>。

  • SVG图形中不应该存在图元与图元相互覆盖或者有偏差的情况,不能只是看起来是连接在一起的,应该提供精确的连接关系。建议导出图元时增加设备端子的导出,如果不能导出端子,则需要提供准确的坐标和连接关系。

  • 多态图元的多个状态应该保持连接端所在的方向的宽度或者高度(或者说连接端子的位置)保持一致,以保证在SVG图形中进行实时状态切换时图形的连接关系仍然正常。

  • SVG图形中,发现有设备图元画在单线图边界框之外,导致导入配网主站系统失败。要求GIS设备图元必须画在一个边界框之内,并保证图形排版整齐不凌乱。

  • 主站系统检测模型质量,尤其是模型拓扑连接关系需要花费的时间较长,如果GIS提供的模型质量较差时,主站需要消耗大量人力进行分析排查,并将结果反馈GIS系统。建议要求GIS系统加强图模导出工具的自测功能,在其导出图模文件时进行测试,将问题在导出操作时进行解决,减少配网主站因导入错误图模文件而造成人力和时间损耗。

    模型文件中的唯一标识RDFID一定要保持全网唯一,而且不允许在只改变设备某些属性的情况下把唯一标识也改了。

    (1)一条馈线为一个数据包(文件夹),包内由变电站一次接线图、站房、地理图文件组成。有联络关系的两条馈线必须同时包含相同的联络设备。

    (2)逻辑层次。GIS所有设备都要归属到配电房(开闭所、相变等)或馈线本身,而配电房要归属馈线。目前建议配电房也使用SubStation类来建模,只是多个属性“SubStation.MemberOf_Feeder”来表示它关联的馈线,依此与变电站分开。馈线要关联变电站,有供电所的还要关联供电所。

    (3)电压等级。一般一条馈线的所有设备电压等级都相同,因此只需要馈线本身与基准电压(Base-Voltage)有关联即可,站房内的配变低压点连接有低压设备,且设备类型应与高压设备进行明确区别。

    (4)拓扑关系。目前接触的所有规范包括数字供电,对设备的端子数都是有具体规定的,而不是无序无范围的。目前接触的GIS模型发现馈线段、母线都会出现多端子情况,应该避免。同时应该避免端子无设备关联。起连接作用的设备为双端子设备,母线为单端子设备,不允许馈线段及其它任何设备出现两个以上的端子。T接开线路,必须由三段线组成。

    (5)边界对应及拼接。一般配网主站都是要和GIS模型做边界拼接,形成一个大网的。二者对边界的信息定义不一致。边界对应信息包括变电站的对应和馈线的对应(变电站侧一般是负荷),目前我们一般是把变电站的信息提供给GIS,GIS在提供模型时包含这个信息。为方便拼接,GIS模型拓扑的起始点一般放到馈线上。

  • (1)智能模糊匹配,一般是通过描述字段进行模糊匹配,可能存在匹配不上的(优点:全自动化导入,不需要维护人员参与;缺点:准确率一般)。

    (2)通过调度编号+所属厂站进行拼接(优点:全自动化导入,不需要维护人员参与,准确率高)。

    (3)在导入工具中加入人工匹配的界面,进行人工确认拼接确保准确(优点:准确率100%;缺点:在导入过程中需要维护人员参与)。

    (4)标准化拼接点的命名规范,如某站10 kV某线某开关、刀闸,让配网GIS和主网对10 kV出线开关统一按照规范命名(优点:相当于已经拼接好的模型了,导入时只需要根据描述匹配就行)。

  • 主网EMS、配网GIS的拓扑连接必须都正确,而且主配网之间拓扑拼接必须正确。因主配网模型数量较为庞大,所以校对准确性的难度较大。在模型导出、导入的过程应建立相应的校正机制与流程,保证主配网拓扑连接正确。

    如果设备归属馈线或站房不正确,则虚拟一个虚拟馈线,每条馈线虚拟一个站房,对信息不正确的归属到虚拟站房。

    如果边界对应信息不匹配,则按变电站侧修改。

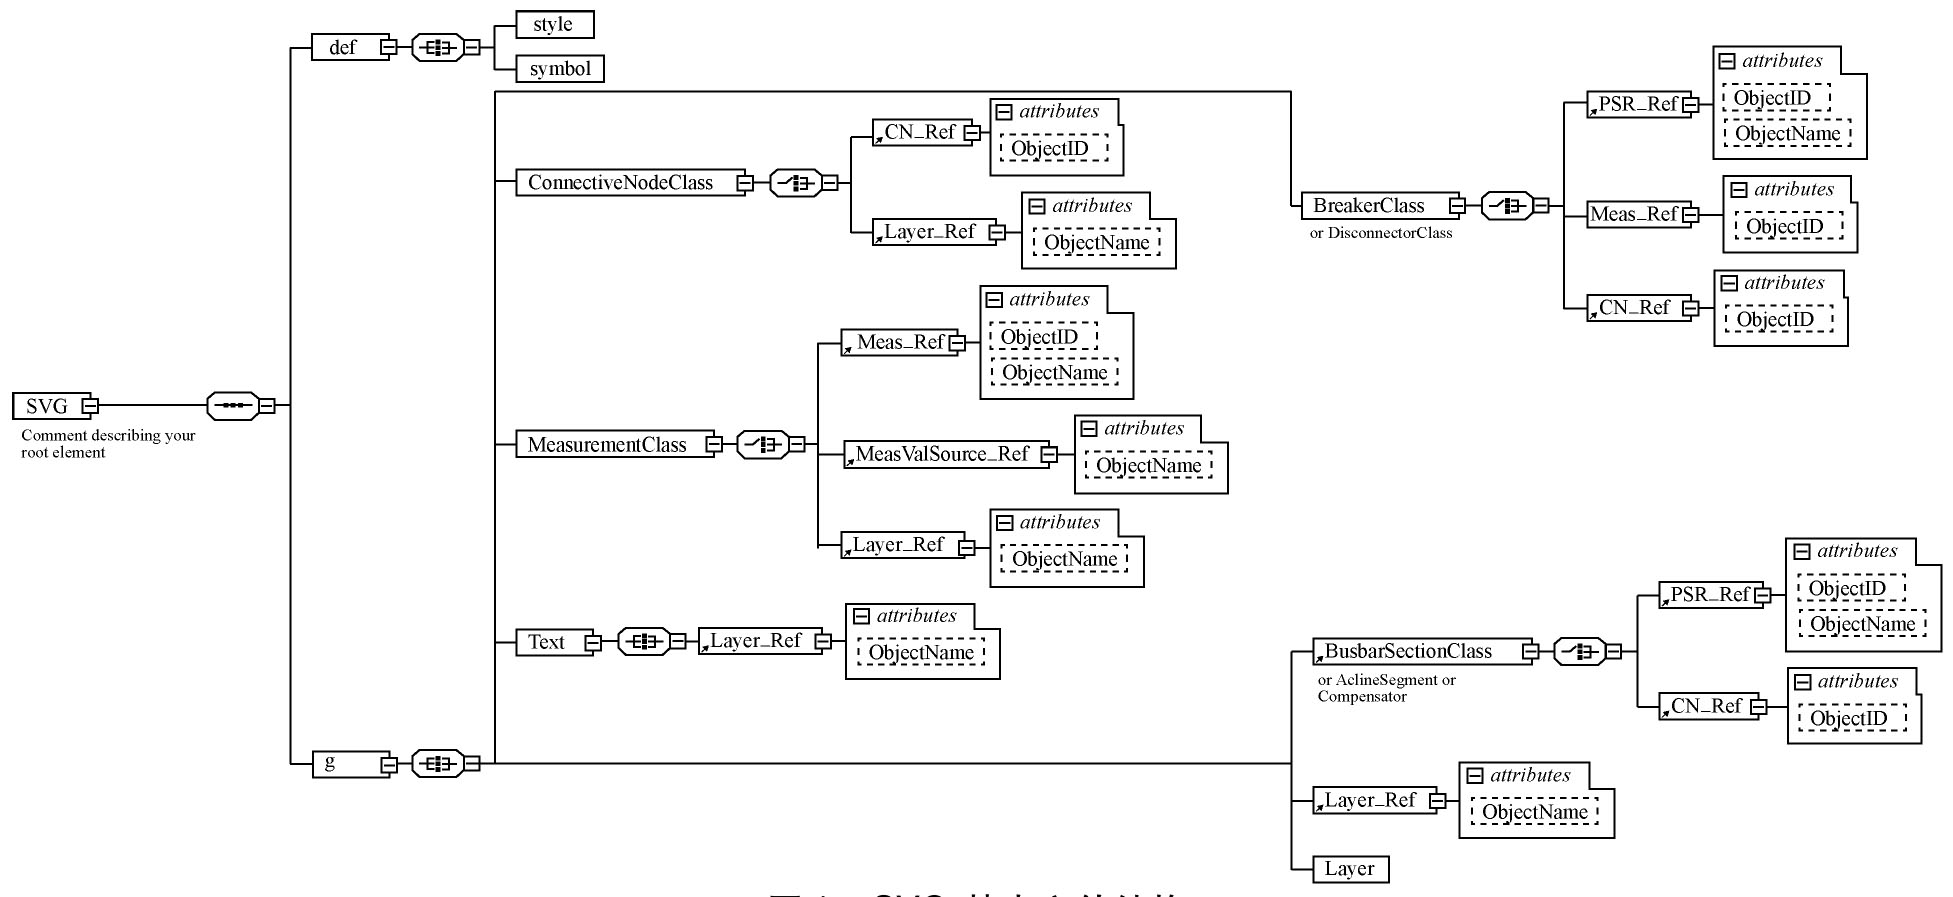
  • 图1给出了在DMS-GIS图形交换中的基本文件结构。

    Figure 1.  SVG File Structure

  • <?xml version=”1.0” standalone=”no” encoding=”UTF-8”?>

    <!DOCTYPE svg PUBLIC ”-//W3C//DTD SVG 1.1//EN”

    ”http://www.w3.org/Graphics/SVG/1.1/DTD/ svg11.dtd”>

    <svg width=”50cm” height=”25cm” viewBox=”0 0 2000 1000” xmlns=”http://www.w3.org/2000/svg ” xmlns:xlink= ”http://www.w3.org/1999/xlink ”xmlns:cge=”http://iec.ch/TC57/2005/SVG-schema# ”>

  • 在GIS向DMS导出图模的实际使用过程中,虽然遵循以上的技术要求,但是发现有些地方需要进行人工调整,才能生成比较美观的单线图。造成这些微小差异的问题尚需进一步研究。

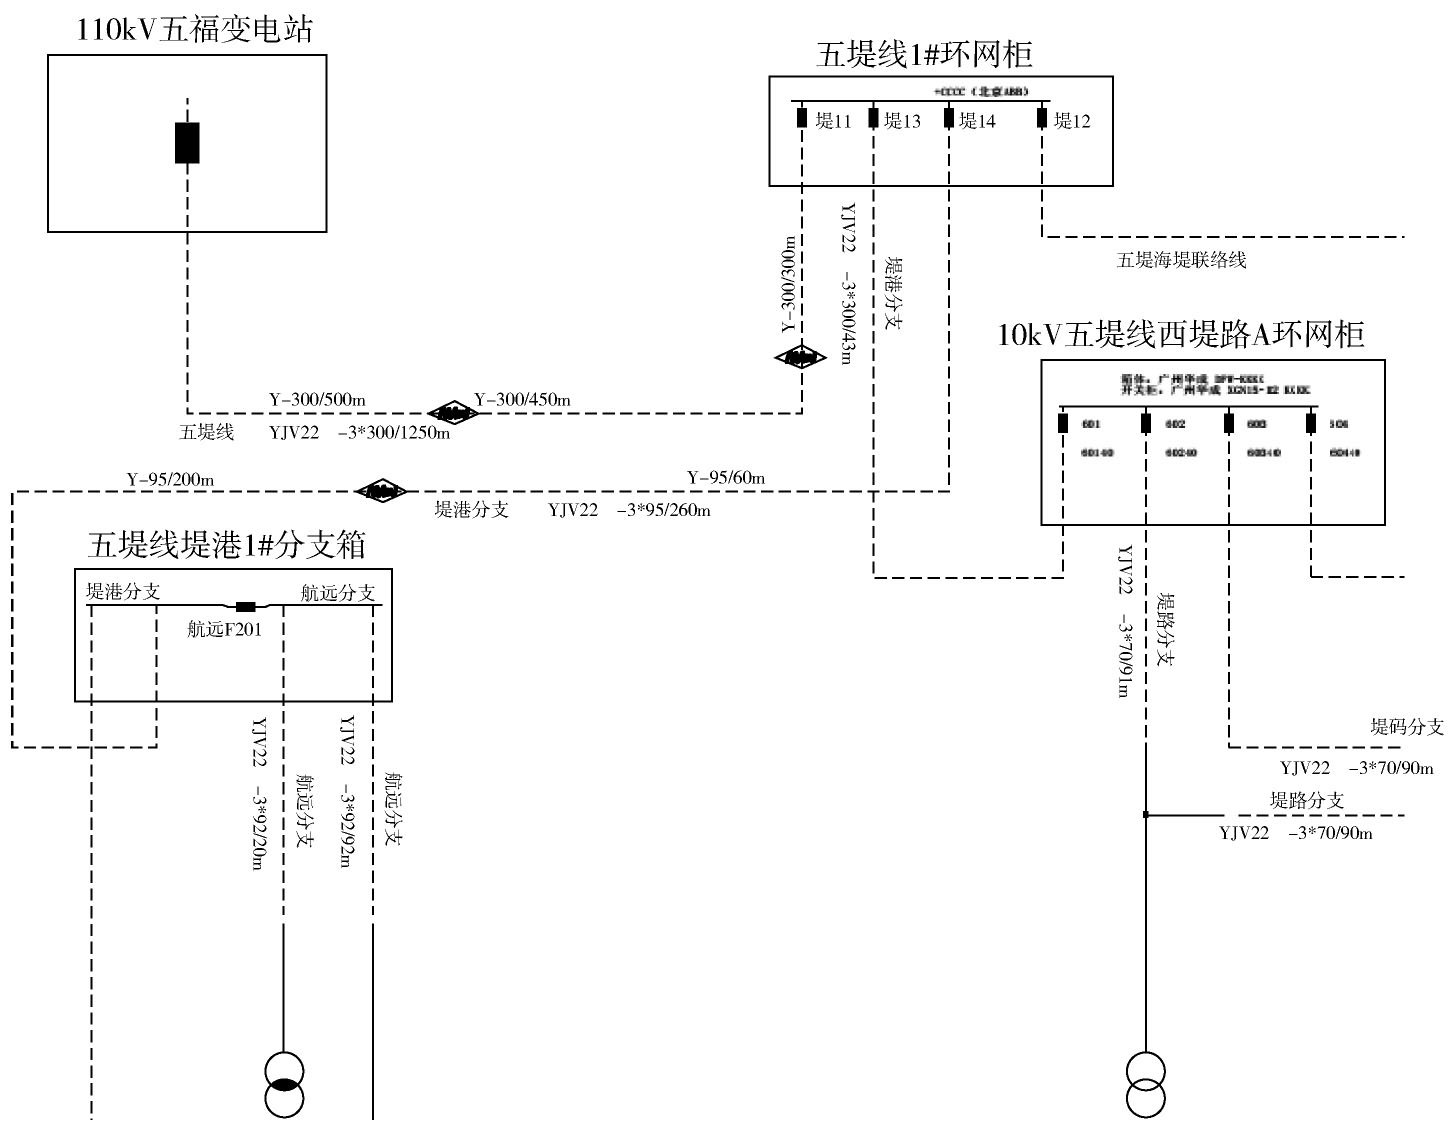
    图2展示了从GIS导出并导入到DMS使用的单线图的效果,这使得调度人员对配电网的状态可视化。

    Figure 2.  Single Line Diagram

  • 本文讨论了从GIS系统自动导出图模并导入配

    网自动化系统的基本要求,并在实际的工程中实现了这些基本要求。下一步工作将继续完善导入的效果。

Reference (4)

Catalog

    /

    DownLoad:  Full-Size Img  PowerPoint
    Return
    Return