• Peer Review
  • Non-profit
  • Global Open Access
  • Green Channel for Rising Stars
Volume 6 Issue 1
Jul.  2020
Turn off MathJax
Article Contents

Sha LIU, Zhongquan WANG, Yanfeng CAI. Wake Loss Analysis of Offshore Wind Farm in Operation[J]. SOUTHERN ENERGY CONSTRUCTION, 2019, 6(1): 66-70. doi: 10.16516/j.gedi.issn2095-8676.2019.01.011
Citation: Sha LIU, Zhongquan WANG, Yanfeng CAI. Wake Loss Analysis of Offshore Wind Farm in Operation[J]. SOUTHERN ENERGY CONSTRUCTION, 2019, 6(1): 66-70. doi: 10.16516/j.gedi.issn2095-8676.2019.01.011

Wake Loss Analysis of Offshore Wind Farm in Operation

doi: 10.16516/j.gedi.issn2095-8676.2019.01.011
  • Received Date: 2019-01-07
  • Rev Recd Date: 2019-03-06
  • Publish Date: 2020-07-11
  •   [Introduction]  In order to understand the wake loss of offshore wind farm, the simulation results are verified to explore the variation law of offshore wake loss.  [Method]  In this paper, the PARK model was used to simulate the wake flow of a offshore wind farm in South China. The parameters of the model were optimized and the actual power output was verified.  [Result]  The results show that application of PARK model in wake simulation of offshore wind farms basically coincides with the actual power output. When wind turbines with 7D spacing in a certain wind direction, the distribution of main wind wake loss after the second row is about 30%.  [Conclusion]  PARK wake model can simulate the wake loss and calculate the power output in offshore wind farms. Sensitivity calculation of model parameters should be carried out to meet the actual conditions.
  • [1] Global Wind Energy Council. Global wind report-annual market update 2017 [R]. Belgium:Global Wind Energy Council,2018.
    [2] HASAGER C B, VINCENT P, BADGER J,et al. Using satellite SAR to characterize the wind flow around offshore wind farms [J]. Energies,2015,8(6): 5413-5439.
    [3] ASTARIZ S, IGLESIAS G. Enhancing wave energy competitiveness through co-located wind and wave energy farms - a review on the shadow effect [J]. Energies,2015,8(7): 7344-7366.
    [4] NEUBERT A,SHAH A,SCHLEZ W. Maximum yield from symmetrical wind farm layouts [C]//DEWEK. 10th German Wind Energy Conference, Bremen, 2010. Oldenburg: GL Garrad Hassan Deutschland GmbH, 2010: 3-6. http://www.gl-garradhassan.com/assets/downloads/Maximum_Yield_from_Symmetrical_Wind_Farm_Layouts.pdf.
    [5] LISSAMAN PBS. Energy effectiveness of arbitrary arrays of wind turbines [J]. Journal of Energy,1979,3(6): 323-328.
    [6] JENSEN N O. A note on wind generator interaction [R]. Denmark:Ris National Laboratory,1983.
    [7] EBERLE W R. Wind flow characteristics in the wakes of large wind turbines. Volume 1:Analytical model development [R]. USA:DOE/NASACR—165380,1981.
    [8] AINSLIE J F. Calculating the flow field in the wake of wind turbines [J]. Journal of Wind Engineering & Industrial Aerodynamics,1988,27(1-3): 213-224.
    [9] LANGE B, WALDL H P, GUERRERO A G,et al. Modelling of offshore wind turbine wakes with the wind farm program flap [J]. Wind Energy,2003,6(1): 87-104.
    [10] SANDERSE B, PIJL S P, KOREN B. Review of computational fluid dynamics for wind turbine wake aerodynamics [J]. Wind Energy,2011,14(7): 799-819.
    [11] WU Y T, PORTÉ-AGEL, FERNANDO. Modeling turbine wakes and power losses within a wind farm using les: an application to the horns rev offshore wind farm [J]. Renewable Energy,2015(75): 945-955.
    [12] FRANDSEN S, BARTHELMIE R, PRYOR S,et al. Analytical modelling of wind speed deficit in large offshore wind farms [J]. Wind Energy,2006,9(1-2): 39-53.
    [13] 张晓东,张镇. 半经验风力机尾流模型的研究 [J]. 太阳能学报,2014,35(1): 101-105.

    ZHANG X D, ZHANG Z. Research of semi-empirical wind turbine wake models [J]. Acta Energiae Solaris Sinica,2014,35(1): 101-105.
    [14] 杨祥生,赵宁,田琳琳,等. 基于Park-Gauss模型的风场尾流数值模拟 [J]. 太阳能学报,2016,37(9): 2224-2229.

    YANG X S, ZHAO N, TIAN L L,et al. Wake numerical simulation of wind farm based on the park-gauss model [J]. Acta Energiae Solaris Sinica,2016,37(9): 2224-2229.
    [15] 袁明友,邱颖宁,冯延晖. 基于二维尾流模型的风电场产能分析 [J]. 可再生能源,2017,35(12): 1854-1861.
  • 通讯作者: 陈斌, bchen63@163.com
    • 1. 

      沈阳化工大学材料科学与工程学院 沈阳 110142

    1. 本站搜索
    2. 百度学术搜索
    3. 万方数据库搜索
    4. CNKI搜索

Figures(8)  / Tables(2)

Article Metrics

Article views(289) PDF downloads(45) Cited by()

Related

Wake Loss Analysis of Offshore Wind Farm in Operation

doi: 10.16516/j.gedi.issn2095-8676.2019.01.011

Abstract:   [Introduction]  In order to understand the wake loss of offshore wind farm, the simulation results are verified to explore the variation law of offshore wake loss.  [Method]  In this paper, the PARK model was used to simulate the wake flow of a offshore wind farm in South China. The parameters of the model were optimized and the actual power output was verified.  [Result]  The results show that application of PARK model in wake simulation of offshore wind farms basically coincides with the actual power output. When wind turbines with 7D spacing in a certain wind direction, the distribution of main wind wake loss after the second row is about 30%.  [Conclusion]  PARK wake model can simulate the wake loss and calculate the power output in offshore wind farms. Sensitivity calculation of model parameters should be carried out to meet the actual conditions.

Sha LIU, Zhongquan WANG, Yanfeng CAI. Wake Loss Analysis of Offshore Wind Farm in Operation[J]. SOUTHERN ENERGY CONSTRUCTION, 2019, 6(1): 66-70. doi: 10.16516/j.gedi.issn2095-8676.2019.01.011
Citation: Sha LIU, Zhongquan WANG, Yanfeng CAI. Wake Loss Analysis of Offshore Wind Farm in Operation[J]. SOUTHERN ENERGY CONSTRUCTION, 2019, 6(1): 66-70. doi: 10.16516/j.gedi.issn2095-8676.2019.01.011
  • 由于海上风能资源丰富,距离负荷中心近,消纳能力强等特点,风电发展逐渐向海上转移。在全球范围内,随着开发技术和相关配套产业的持续进步,海上风电开发已经成为各国能源投资与发展的新热点[1]。与陆上风电场相比,海上风电场不受地形干扰,风能资源分布相对均衡,因此风电机组的布置在空间上呈现出更为规整的几何形态[2,3,4]。但与此同时,海上风电场的尾流效应更加显著,表现为尾流传播距离更远,存在多台、多排风机的尾流叠加与相互影响,风速恢复缓慢等特点,由此导致的发电量损失更为严重。鉴于上述情况,海上风电场的尾流效应一直是业界研究的重点。

    为了准确描述风电机组的尾流效应,定量评估由此带来的发电量损失,尾流模型(Wake Model)应运而生。国外关于风电机组尾流模型的研究起步于上世纪70、80年代,并陆续发展出一系列基于实验总结的一维半经验模型,如Lissaman模型[5]、Jensen/PARK模型[6]、无粘近场尾流模型[7]、Abramovich射流理论尾流模型等。随后,有学者采用涡粘理论求解Navier-Stokes方程,得到基于数值方法的二维模型,如Ainslie模型[8]、FLaP模型[9]等。进入上世纪90年代,随着计算流体力学(CFD)技术的发展,有学者采用雷诺平均方法(RANS)或驱动盘技术[10],发展三维尾流模型。进入本世纪后,大涡模拟(LES)技术[11]也开始应用在尾流模型中。目前已经发展出专门针对海上大型风电场的尾流模型[12]

    国内关于尾流模型的研究集中在近10年,主要工作为对已有尾流模型的验证,以及对一维或二维尾流模型的改进[13,14,15]等,但专门针对海上风电场的尾流模型研究工作较少。本文将利用华南某海上风电场实际运行期间的风电机组SCADA记录,对Jensen/PARK模型及其参数设置进行验证,并进一步分析该风电场的尾流特性,为优化风电场风机布局,科学进行海上风电场微观选址,提升风机发电效率并延长风机使用寿命提供参考。

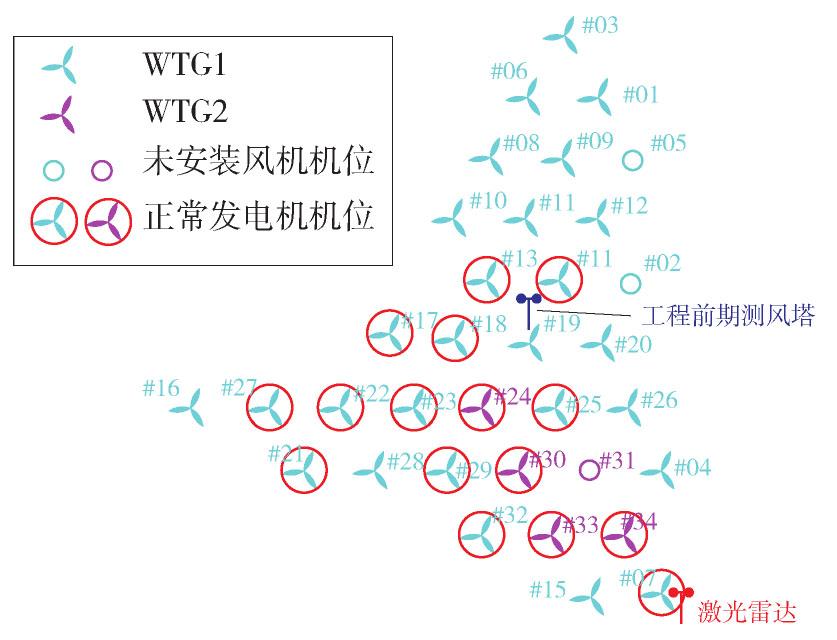
  • 本文选取华南地区某海上风电场作为测试场址,该项目设计安装34台3 MW风电机组,实际安装31台(如图1所示),建成总装机容量为93 MW。31台3 MW风机排布间距为7倍叶轮直径,截至测试时间,31台风机中的16台正常并网发电。工程前期测风的海上测风塔位于风电场中心位置19#风机北侧160 m,在风机施工安装前已经拆除;目前在7#风机东南方向约400 m处设立激光雷达测风装置。

    Figure 1.  Wind turbine layout

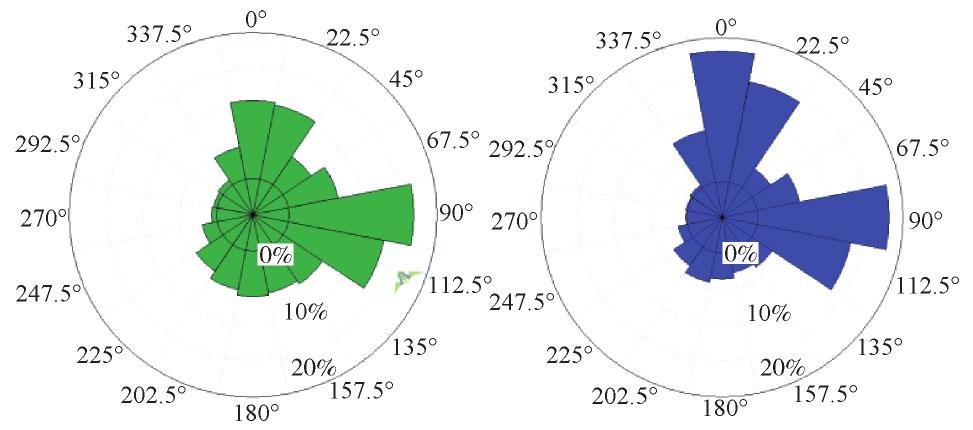
    项目前期测风塔代表年90 m高度处年平均风速为7.21 m/s,风功率密度401 W/m2。风速分布主要集中在4.0~12.0 m/s风速段,所占比例约为84.99%;风能主要集中在7.0~15.0 m/s风速段,所占比例约为80.26%。风电场主风向和最大风能密度的方向基本一致,以ESE、E、N、NNE向风向频率和风能频率较大,风能分布方向不集中,呈现垂直主风向的状态(如图2所示)。

    Figure 2.  Wind direction and wind energy direction distribution (left: wind direction distribution; right: wind energy direction distribution)

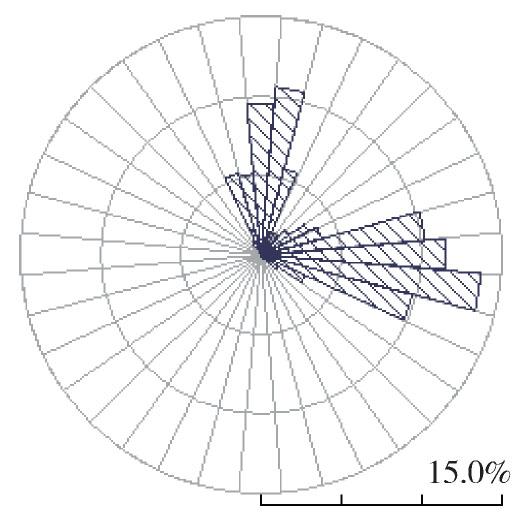
  • 本阶段获取发电的16台风机(如图1中红色圆圈所示)2018年10月至11月的运行数据进行风电场尾流的评估。测试期间雷达测风点的平均风速为7.15 m/s,主风方向为E和N(如图3所示),且以E风向的频率最高,与本项目前期风资源评估的水平年风速7.21 m/s及风向分布接近一致(如图2所示),因此激光雷达测风装置在2018年10月至11月期间的数据,对于本场址的风资源情况具有较好的代表性。

    Figure 3.  Lidar wind direction distribution at 90 m from Oct. to Nov. 2018

    图1所示,在东西方向上,风机布局呈横排布置,选择主导风向中的E风向的风速时段进行场址内风机尾流影响研究,可以充分利用现有的发电数据进行实际验证。基于上述考虑,在E方向上,选择已运行的其中一排风机(21#、22#、23#、24#、25#)开展尾流模拟与验证研究。

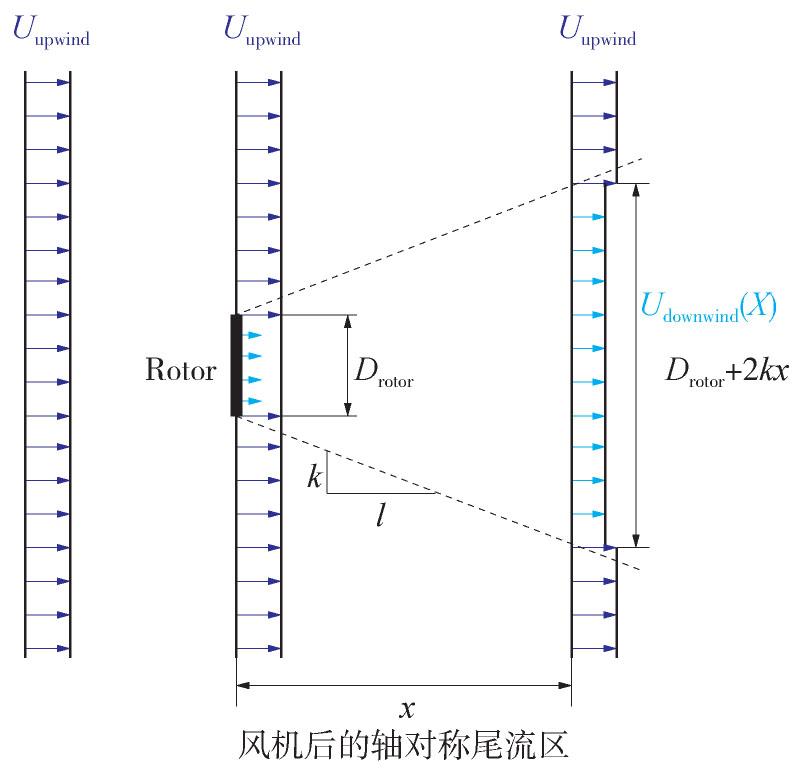
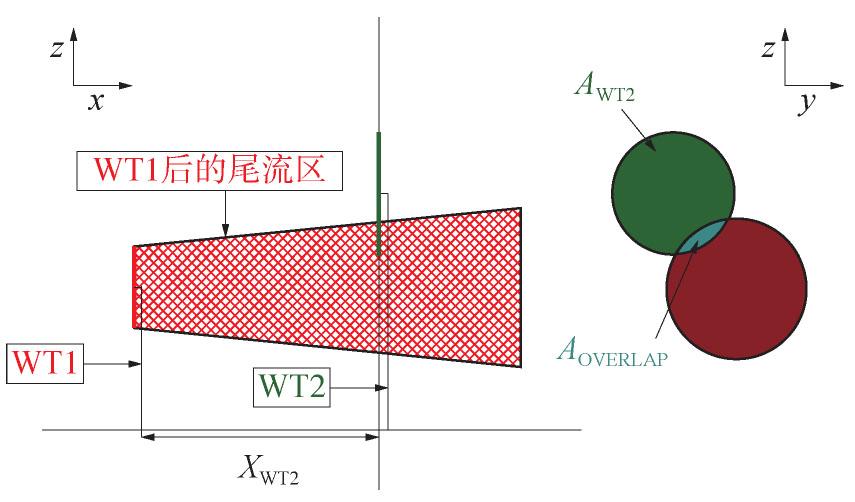
  • PARK尾流模型假定气流经过风机叶轮后所形成的尾流沿风机中心线呈轴对称形态,并且尾流宽度随着下风方向距离x的增加而呈线性增加,但速度衰减逐渐恢复(如图4所示)。如果一台风力发电机的叶轮部分位于另一台风力发电机的尾流区域中,风速衰减是与两台风力发电机的叶轮重叠面积成比例(如图5所示):

    Figure 4.  PARK wake model sketch

    Figure 5.  Wake influence region of PARK wake model

    ((1))

    式中:AOVERLAP为叶轮重叠面积;AWT2为下游风机叶轮面积;Ct为风机推力系数;D为风机叶轮直径;k为尾流衰减因子。

    尾流叠加是采用速度衰减平方和叠加形式:

    ((2))
  • 为验证尾流在不同风速情况下的特征,本文选取场址区域高频风速区间5~10 m/s(分为4.5~ 5.4 m/s、5.5~6.4 m/s、6.5~7.47 m/s、7.5~8.4 m/s、8.5~9.4 m/s、9.5~10.4 m/s风速段),分别利用PARK模型开展E风向下的场址区域尾流模拟。同时利用SCADA数据,对21#、22#、23#、24#、25#机位E风向下各风速区间的实际出力进行统计。最后采用平均绝对误差(MAE)和均方根误差(RMSE)两个统计指标对PARK模型的模拟结果进行验证。

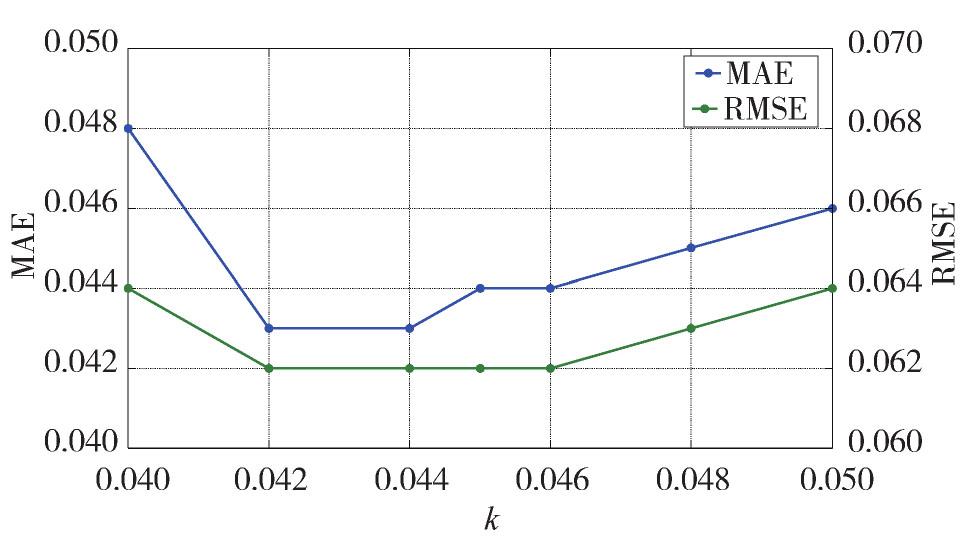
  • PARK模型计算的核心在于通过定义尾流衰减因子k来表示尾流的线性扩张。尾流衰减因子k与环境湍流及地面粗糙度相关,随着环境湍流强度的增加而增大。对于海上风电场,常用取值在0.04~0.05之间。如图6所示,分别测试k的取值对5~10 m/s风速段的整体模拟精度的影响,k取0.044时模拟误差较低。

    Figure 6.  5~10 m/s wind simulation MAE for different k value

  • 对于PARK模型,风向扇区范围的选择对模拟结果精度产生一定的影响。针对E向,设置四组不同的风向扇区范围进行比较,分别为90°±2°、90°±5°、90°±10°、90°±15°,对5~10 m/s风速段的整体模拟精度进行计算。结果如表1所示,90°±10°的风向扇区范围与实际出力偏差最小。

    统计指标 风向扇区
    90°±2° 90°±5° 90°±10° 90°±15°
    MAE 0.186 0.144 0.047 0.072
    RMSE 0.117 0.099 0.067 0.077

    Table 1.  5~10 m/s wind simulation MAE and RMSE for different wind direction range

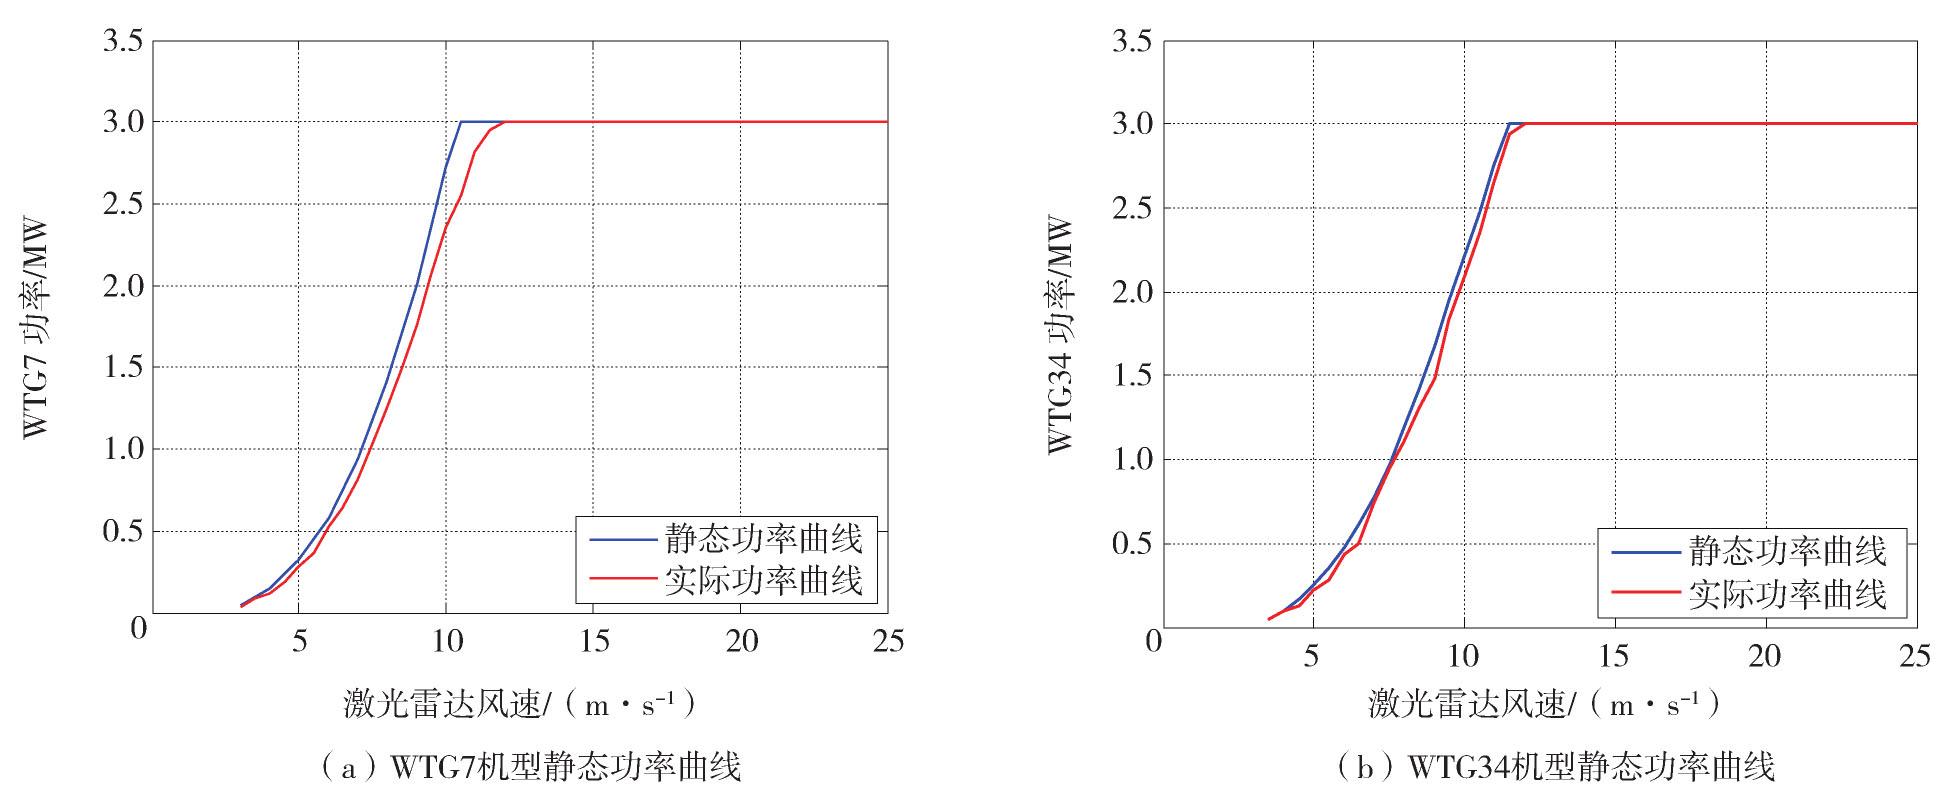
  • 利用激光雷达进行7#风机SCADA获取的同期风速数据进行传递函数的确定,推导风机机位处叶轮前实际风速,绘制实际风速与风功率对应关系(如图7所示),作为用于计算的动态功率曲线。

    Figure 7.  Comparison of static power curve and actual power curve of two different types of wind turbine

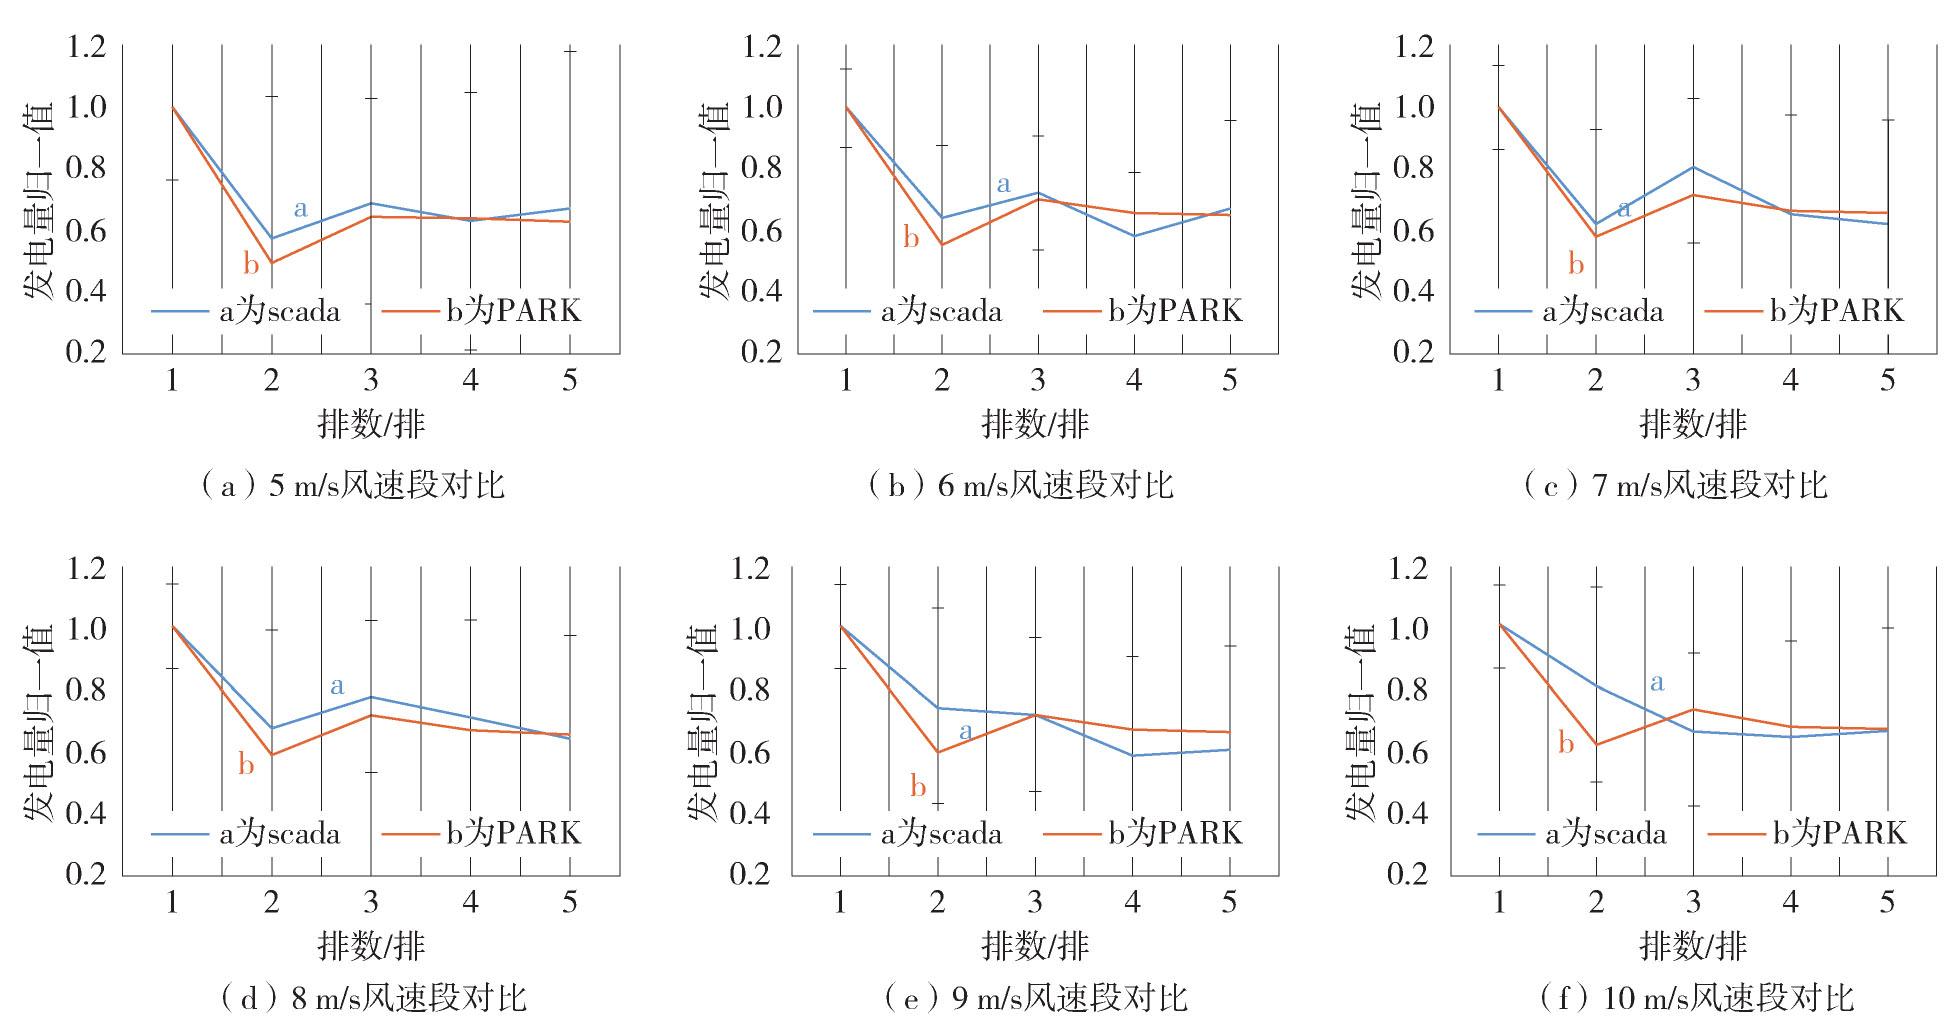
  • 基于上述取得的误差最小情况下的尾流衰减系数0.044与风向扇区范围90°±10°,计算PARK模型的各风机在5~10 m/s各风速段内的尾流损失,与实际运行过程中同期E风向下的各风机发电尾流损失进行对比分析。为方便比较,对模拟结果与实测结果均进行了归一化处理,如图8所示。

    Figure 8.  Comparisons between calculated wake loss and actual wake loss in 5~10 m/s respective wind speed range

    对各个风速段内的模型计算及实际发电情况进行对比发现,模型计算结果可以基本反映出实际情况下的风电场运行发电损失。每排模拟误差如表2所示,PARK模型在第二排和第三排计算误差较第四排以后表现更为明显。在实际运行中,第2排以后的实际发电量损失在各排的分布差别不大,约30%左右。

    统计指标 风向扇区
    第二排 第三排 第四排 第五排
    MAE 0.105 0.048 0.041 0.026
    RMSE 0.057 0.056 0.047 0.032

    Table 2.  Wind simulation MAE and RMSE per row in 5~10 m/s wind speed range

  • 1)PARK模型用于海上风电场尾流模拟可基本反映风机实际发电情况,PARK模型与实际运行结果之间平均绝对误差为0.047。

    2)本项目风机间距为7D、风速介于5~10 m/s之间时,通过对比模型计算结果与海上风电场现场运行数据发现,尾流损失在第2排后的分布规律呈现较为稳定的状态,约为30%。

    3)PARK尾流模型较好的模拟计算近海风电场尾流损失和发电量计算,模型参数选择应参考已建项目实际情况并进行敏感性测算。

    4)目前结论基于华南地区某海上风电场为期2个月的运行数据分析得出,普适性的结论需后续获取更多数据的基础上结合其它海上风电场运行情况进行补充分析。

Reference (15)

Catalog

    /

    DownLoad:  Full-Size Img  PowerPoint
    Return
    Return