• Peer Review
  • Non-profit
  • Global Open Access
  • Green Channel for Rising Stars
Volume 6 Issue 1
Jul.  2020
Turn off MathJax
Article Contents

Jun RUAN, Xiongjun TAO, Xinke WEI, Hongsheng LI. 3D Modeling and Tree Barrier Analysis of Transmission Lines Based on LIDAR Point Cloud Data of Fixed Wing UAV[J]. SOUTHERN ENERGY CONSTRUCTION, 2019, 6(1): 114-118. doi: 10.16516/j.gedi.issn2095-8676.2019.01.020
Citation: Jun RUAN, Xiongjun TAO, Xinke WEI, Hongsheng LI. 3D Modeling and Tree Barrier Analysis of Transmission Lines Based on LIDAR Point Cloud Data of Fixed Wing UAV[J]. SOUTHERN ENERGY CONSTRUCTION, 2019, 6(1): 114-118. doi: 10.16516/j.gedi.issn2095-8676.2019.01.020

3D Modeling and Tree Barrier Analysis of Transmission Lines Based on LIDAR Point Cloud Data of Fixed Wing UAV

doi: 10.16516/j.gedi.issn2095-8676.2019.01.020
  • Received Date: 2018-09-13
  • Rev Recd Date: 2018-09-28
  • Publish Date: 2020-07-11
  •   [Introduction]  Aiming at the problems of long inspection period, high operation intensity and no guarantee of objectivity and integrity of inspection results of the current tree barrier inspection of transmission line, this paper presents a method for three-dimensional modeling of transmission lines and intelligent identification of dangers of tree barriers based on three-dimensional laser point cloud data of fixed-wing UAV.  [Method]  Point cloud data of transmission lines was collected by three-dimensional laser scanner equipped with fixed wing UAVs, then extracted the power line points in the point cloud and simulate the complete power lines, calculated the euclidean distance between vegetation and power line protection area, and we can get the information of tree barriaer points or early-warning points through comparing the calculated results with the power line safety specifications.  [Result]  The test results showed that the error of automatic fitting power line is small, which meeted the requirements of tree barrier detection.  [Conclusion]  This method can extract power lines automatically, quickly and completely, and the extraction accuracy meets the accuracy requirements of tree barrier detection, greatly improved the quality and efficiency of existing tree barrier danger detection method of transmission line.
  • [1] 浦石,吴新桥,燕正亮,等. 无人机激光雷达智能识别输电线路缺陷 [J]. 遥感信息,2017,32(4): 52-57.

    PU S, WU X Q, YAN Z L, et al. Automatic recognition of defects on transmission lines from UAV-borne laser scanning data [J]. Remote Sensing Information, 2017, 32(4): 52-57.
    [2] 周汝琴,翟瑞聪,江万寿,等. 机载激光点云数据中分裂导线自动提取和重建 [J]. 测绘科学,2018,43(6): 124-130.

    ZHOU R Q, ZHAI R C, JIANG W S, et al. Automatic extraction and reconstruction of bundle conductors from airborne LiDAR point clouds [J]. Science of Surveying & Mapping, 2018, 43(6): 124-130.
    [3] 段敏燕. 机载激光雷达点云电力线三维重建方法研究 [D]. 武汉大学,2015.

    DUAN M Y. Research on power line 3D reconstruction method of airborne LIDAR point cloud [D]. Wuhan: Wuhan University, 2015.
    [4] 林祥国,张继贤. 架空输电线路机载激光雷达点云电力线三维重建 [J]. 测绘学报,2016,45(3): 347-353.

    LIN X G, ZHANG J X. 3D power line reconstruction from airborne LiDAR point cloud of overhead electric power transmission corridors [J]. Acta Geodaetica Et Cartographica Sinica, 2016, 45(3): 347-353.
    [5] 叶岚,刘倩,胡庆武. 基于LIDAR点云数据的电力线提取和拟合方法研究 [J]. 测绘与空间地理信息,2010,33(5): 30-34.

    YE L, LIU Q, HU Q W. Research of power Line fitting and extraction techniques based on LIDAR point cloud data [J]. Geomatics & Spatial Information Technology, 2010, 33(5): 30-34.
    [6] 余洁,穆超,冯延明,等. 机载LiDAR点云数据中电力线的提取方法研究 [J]. 武汉大学学报(信息科学版),2011,36(11): 1275-1279.

    YU J, MU C, FENG Y M, et al. Powerlines extraction techniques from airborne LiDAR data [J]. Geomatics & Information Science of Wuhan University, 2011, 36(11): 1275-1279.
    [7] 赖旭东,戴大昌,郑敏,等. LiDAR点云数据的电力线3维重建 [J]. 遥感学报,2014,18(6): 1223-1229.

    LAI X D, DAI D C, ZHENG M, et al. Powerline three-dimensional reconstruction for LiDAR point cloud data [J]. Journal of Remote Sensing, 2014, 18(6): 1223-1229.
    [8] 尹辉增,孙轩,聂振钢. 基于机载激光点云数据的电力线自动提取算法 [J]. 地理与地理信息科学,2012,28(2): 31-34+2.

    YIN H Z, SUN X, NIE Z G. Power line automatic extraction algorithm based on airborne laser point cloud data [J]. Geography and Geo-information Science, 2012, 28(2): 31-34+2.
    [9] 杜娥. 基于ADAMS的巡线机器人运动学、动力学仿真 [D]. 武汉:武汉大学,2005.

    DU E. Kinematics and dynamics simulation of inspection robot based on ADAMS [D]. Wuhan:Wuhan University,2005.
    [10] 范亮,汤坚. 架空输电线路三维建模方法现状及展望 [J]. 南方能源建设,2017,4(2): 120-125.

    FAN L, TANG J. Current situation and Prospect of 3D modeling method for overhead transmission lines [J]. Southern Energy Construction, 2017, 4(2): 120-125.
    [11] 杨喆,邓超怡. 无人机在特高压输电线路巡检中的应用研究 [J]. 南方能源建设,2016,3(增刊1): 135-138.

    YANG Z, DENG C Y. Application of UAV in UHV transmission line inspection [J]. Southern Energy Construction, 2016, 3(supp.1): 135-138.
  • 通讯作者: 陈斌, bchen63@163.com
    • 1. 

      沈阳化工大学材料科学与工程学院 沈阳 110142

    1. 本站搜索
    2. 百度学术搜索
    3. 万方数据库搜索
    4. CNKI搜索

Figures(7)  / Tables(2)

Article Metrics

Article views(724) PDF downloads(91) Cited by()

Related

3D Modeling and Tree Barrier Analysis of Transmission Lines Based on LIDAR Point Cloud Data of Fixed Wing UAV

doi: 10.16516/j.gedi.issn2095-8676.2019.01.020

Abstract:   [Introduction]  Aiming at the problems of long inspection period, high operation intensity and no guarantee of objectivity and integrity of inspection results of the current tree barrier inspection of transmission line, this paper presents a method for three-dimensional modeling of transmission lines and intelligent identification of dangers of tree barriers based on three-dimensional laser point cloud data of fixed-wing UAV.  [Method]  Point cloud data of transmission lines was collected by three-dimensional laser scanner equipped with fixed wing UAVs, then extracted the power line points in the point cloud and simulate the complete power lines, calculated the euclidean distance between vegetation and power line protection area, and we can get the information of tree barriaer points or early-warning points through comparing the calculated results with the power line safety specifications.  [Result]  The test results showed that the error of automatic fitting power line is small, which meeted the requirements of tree barrier detection.  [Conclusion]  This method can extract power lines automatically, quickly and completely, and the extraction accuracy meets the accuracy requirements of tree barrier detection, greatly improved the quality and efficiency of existing tree barrier danger detection method of transmission line.

Jun RUAN, Xiongjun TAO, Xinke WEI, Hongsheng LI. 3D Modeling and Tree Barrier Analysis of Transmission Lines Based on LIDAR Point Cloud Data of Fixed Wing UAV[J]. SOUTHERN ENERGY CONSTRUCTION, 2019, 6(1): 114-118. doi: 10.16516/j.gedi.issn2095-8676.2019.01.020
Citation: Jun RUAN, Xiongjun TAO, Xinke WEI, Hongsheng LI. 3D Modeling and Tree Barrier Analysis of Transmission Lines Based on LIDAR Point Cloud Data of Fixed Wing UAV[J]. SOUTHERN ENERGY CONSTRUCTION, 2019, 6(1): 114-118. doi: 10.16516/j.gedi.issn2095-8676.2019.01.020
  • 随着我国经济的发展,高等级、长距离输电线路越来越多,输电通道走廊的地形越来越复杂,给线路的管理和监测带来了很多困难。目前,国内对架空输电线路通道林木树障信息的采集,主要包括人工树障隐患采集,无人机可见光树障隐患采集和激光雷达树障隐患采集等方式。传统的树障隐患采集方法主要以人工目测为主,不但工作强度大,而且难以确定具体位置,效率低。随着无人机技术的兴起,国内外越来越多的研究学者开始利用低空可见光航拍影像进行输电线安全距离的检测,存在精度差、不稳定等问题。激光雷达(LiDAR)技术通过激光实现回波测距和定向的技术,融合了激光测距、差分定位、姿态测量,利用物体的反射特性来获取目标物的位置、径向速度等信息,从而实现对目标物的识别。基于激光雷达技术的电力行业应用也在逐渐深入,目前已经取得了一定的研究成果[1,2,3]。有学者提出了一种将全球定位系统、惯性导航系统和计算机视觉组合的导航方法,再利用激光测高仪,可以对CCD序列成像进行光流分析,不仅可以获取导航信息来实现输电线安全距离的检测,而且能实现三维场景的重建[4]。澳大利亚GSIRO(联邦科学与工业研究组织)通信技术中心的研究人员专心于研发小型的T21型巡线无人机,并在无人机上安装激光测距仪,可以准确测量导线到导线下方地物的距离[5,6]

    本文基于分类的点云数据以及自动提取的电力线矢量数据,采用点云距离计算方法计算线路与线路走廊下方地面/地物的距离,并自动根据电压等级与标准安全距离做比较,对于距离小于安全距离的区域进行危险预警。然后通过可视化校核技术,对树障分析结果进行校核,以提高树障隐患分析的准确性,减少外业工作,提高工作效率。

  • 输电线路点云数据三维建模,首先需要将点云数据中的电力线点提取出来。基于断面分析法获取的断面点云数据,利用k-means聚类分析算法、筛选算法以及基于法向约束的点云融合算法等确定电力线的数目和起点,并基于高度的最小值确定电力线的下导线[7]。然后利用区域生长算法进行导线追踪,实现电力线点云的提取。

    由于雷达数据具有多次回波的特性,电力线上方一般没有其他遮挡物,因此电力线点云主要集中在雷达的首次回波中。因此,提取首次回波的激光点,就可以滤除一部分植被点,而保留全部电力线点。此外,电力线在局部里高程基本相同,而植被高程一般起伏较明显,根据这一特征,本文提出一种滤波方法可进一步提取电力线点。

    对于点p(i),在固定半径r的圆形区域中,如果该点与区域中其他点之间的最大倾斜角度小于一定阈值β,则该点纳入电力线点范围,反之则是树木点。点p(i)p(i-1)之间的倾斜角度S的计算公式如下:

    ((1))

    式中:(xi, yi, zi)、(xi-1, yi-1, zi-1)分别是点p(i)p(i-1)的三维坐标。

    使用这种方法,通过设定一定的参数,可使首次回波点中的植被点和杆塔点得到最大程度的滤除,从而充分提取电力线点。

  • 提取电力线点后,需要对输电线路中的多条电力线进行分类。电力线一般呈线状分布,具有较强的延伸性,且同一线路不同电力线的投影呈直线,其分裂导线相互平行[8]。基于电力线的此特征,对分离出来的电力线点和少量植被点,将其投影到XY平面,对投影点的XY坐标作Hough变换,以提取XY平面上的电力直线,得到若干条电力线的直线方程。然后,计算平面上每个点到直线方程的距离,当距离小于一定阈值时,将此点归属到对应的电力直线。所有点归类到直线后,即可对每一单条电力线进行曲线拟合[9]

  • 在小范围区域点云中,高程极大值位置即为杆塔位置。两杆塔间的电力线属于自然悬垂线,符合双曲余弦函数模型,因此可根据此特征对电力线进行拟合,曲线方程为:

    ((2))

    将两杆塔间的点云数据投影到输电线路纵剖面,利用曲线拟合和函数逼近方法求解上式[10],得到每条电力线的最佳参数,即可完成每条电力线的三维建模。

  • 分类后的点云数据经电力线三维建模后,即可对电力线和线路走廊地物间的距离进行量测,完成安全距离诊断。基于拟合的电力线矢量数据和植被点云数据,可量测任意位置输电线路与植被的距离[11],将量测的结果与电力线安全规范比较得出树障点或预警点等信息,根据电网规范将一定空间范围内的地物进行等级划分,得到紧急缺陷、重大缺陷、一般缺陷及关注点等相关信息,并自动生成树障隐患报告。

  • 基于Visual Studio 2010 C++集成开发了基于激光点云实现电力线三维重建及缺陷检测。试验平台配置:ThinkPad L470,配置为i7-8550U,运行平台为Windows 7系统。

  • 本次实验采用纵横CW-30LiDAR垂直起降固定翼无人机搭载获取输电线路点云数据。试验飞行速度25 m/s,飞行高度约200 m。激光雷达参数如表1所示。

    指 标 参 数
    激光等级 1级,人眼安全
    波长 近红外
    精度/ cm ±1.5
    最大有效测量速率/ (Pts·s-1) 750 000
    扫描角(FOV) / (°) 330
    回波处理 多周期回波处理
    最大测距/ m 1 350

    Table 1.  Parameters of lidar

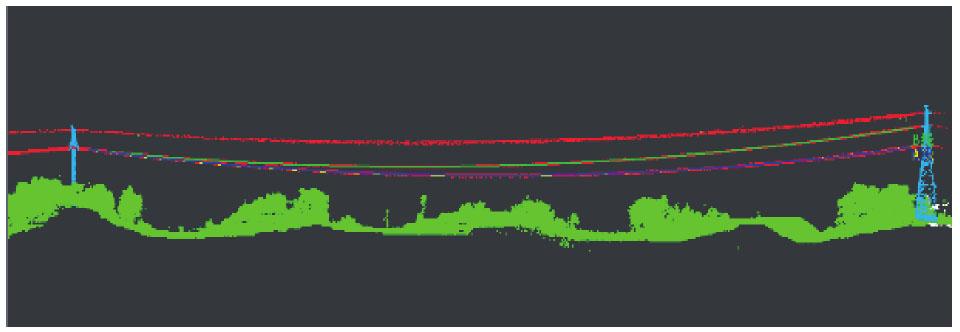
  • 首先导入点云数据,然后加载杆塔文件,根据杆塔位置,将点云数据分档处理,点云数据与电力杆塔数据叠加示意图如图1所示。

    Figure 1.  Superposition of point cloud data and power tower data

  • 首先,提取相邻电塔间电力线点云,将其作为一个处理单元,对每个单元进行电力线提取:利用KD邻域搜索最近点,并根据单条电力线的点云高程连续变化、XY平面呈直线分布等特性,跟踪同根电力线上相邻点云;对每条电力线点云,采用多项式模型进行拟合,即可完成电力线三维建模。提取效果图如图2所示:

    Figure 2.  Automatic extraction of power lines

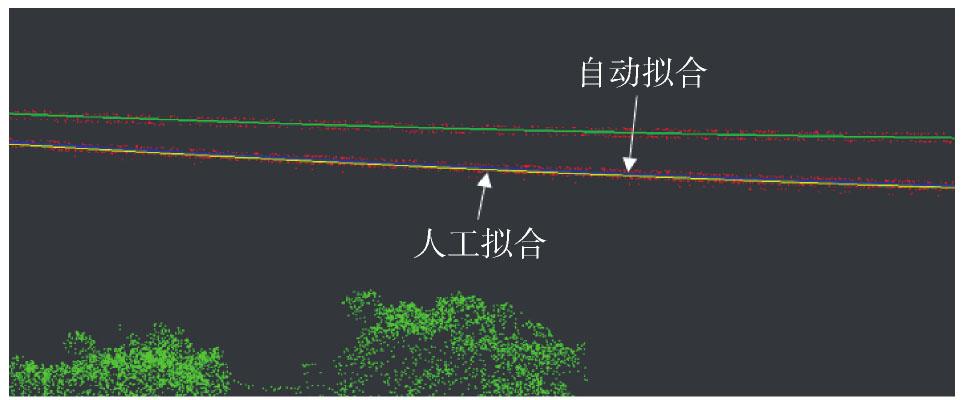
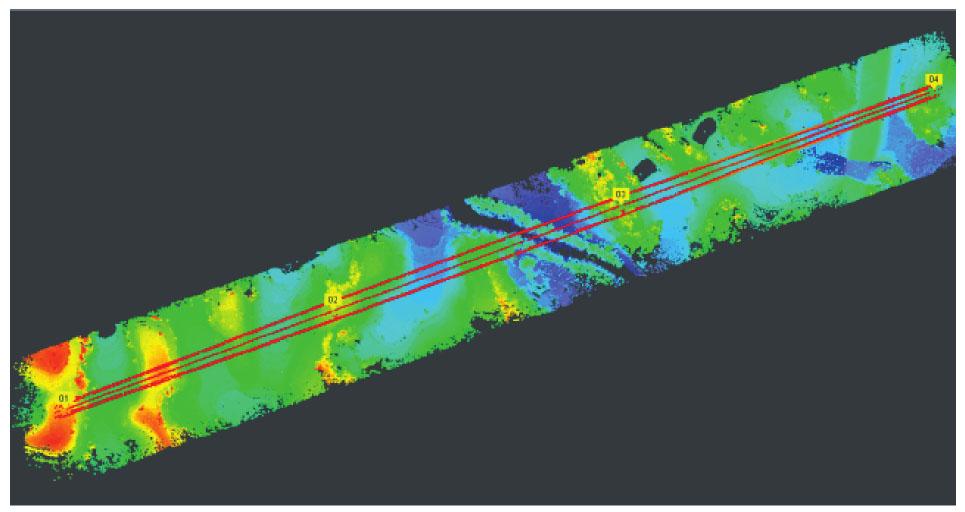
  • 对自动提取的电力线,需要对其提取精度进行评估。本文以人工判别拟合的电力线为参考,测量自动拟合电力线到参考电力线的距离,根据距离评估电力线自动提取的精度。

    自动拟合和人工判别拟合的电力线对比图如图3图4所示:

    Figure 3.  Comparison of automatic and manual fitting of power lines

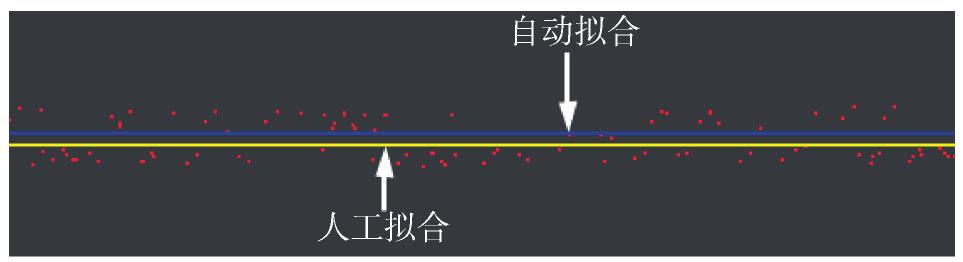
    Figure 4.  Fractionated gain comparison of automatic and manual fitting of power lines

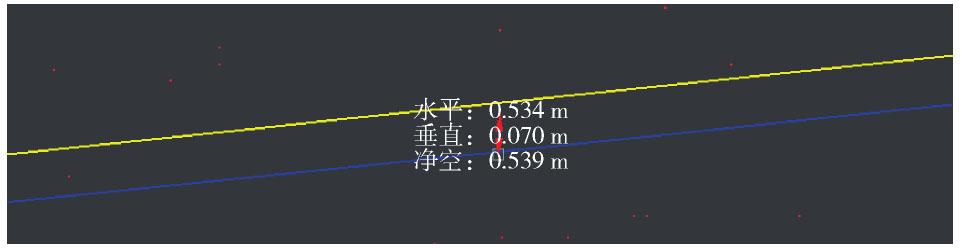
    在相邻两杆塔之间沿导线均匀选取10个位置,测量每个位置自动拟合电力线与人工拟合电力线之间的水平距离、净空距离和垂直距离(如表2图5所示)。

    Figure 5.  Error of automatic fitting and manual fitting

    位置点 1 2 3 4 5 6 7 8 9 10 平均
    水平距离/m 0.285 0.332 0.534 0.198 0.178 0.181 0.230 0.212 0.167 0.156 0.247
    垂直距离/m 0.109 0.094 0.070 0.231 0.139 0.089 0.167 0.157 0.234 0.145 0.144
    净空距离/m 0.293 0.334 0.539 0.264 0.201 0.213 0.244 0.220 0.232 0.167 0.271

    Table 2.  Error of automatic fitting and manual fitting

    结果表明,自动拟合的电力线与人工判别拟合的电力线水平距离约为0.247 m,垂直距离约为0.144 m,净空距离约为0.271 m,误差均较小,自动拟合的电力线精度较高,尤其是垂直距离误差最小,满足树障检测的要求。

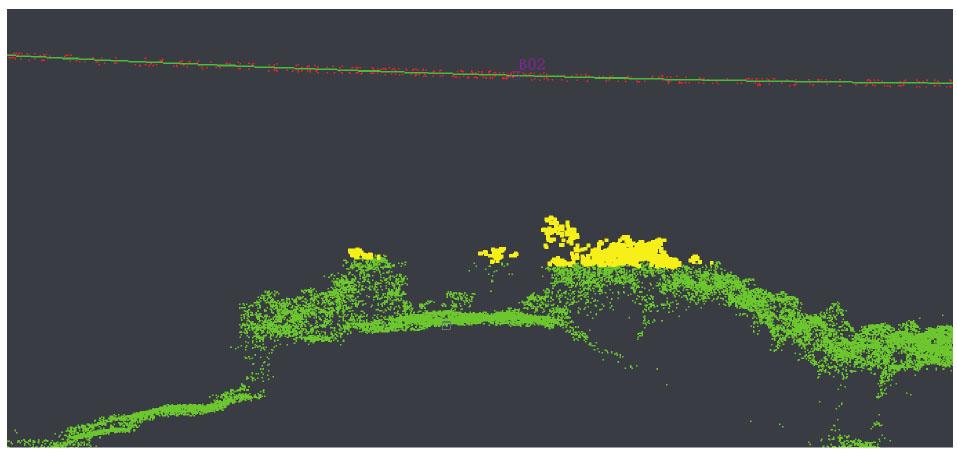
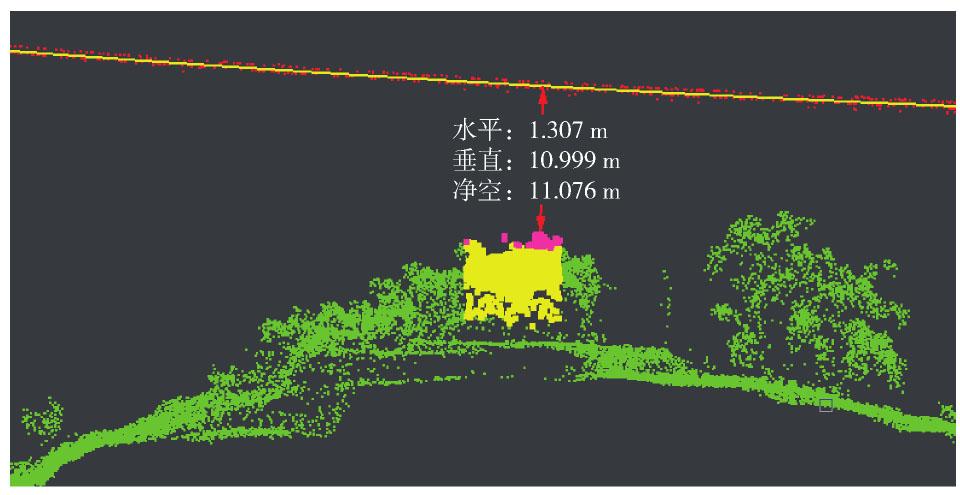
  • 量测提取的电力线到植被点云的距离,根据线路安全运行规程所规定的安全距离,判断是否有植被达到安全距离内,如果存在,则确认为树障隐患点位置(如图6图7所示),并保存至树障数据库,同时可以自动生成树障隐患报告并导出。

    Figure 6.  Tree barrier detection results

    Figure 7.  Euclidean distance of tree barrier points

  • 以上测试数据的结果表明,本文提出的方法可基于输电线路激光点云数据实现多个电塔间多层电力线的自动、快速、完整提取建模,自动提取电力线的精度满足树障检测的精度要求,且与传统树障检测方式相比,速度快、位置准确、效率高。

  • 本文提出一套无人机三维激光雷达智能识别输电线路缺陷研究方法。通过固定翼无人机搭载三维激光雷达扫描仪获取输电线路点云数据,提取点云中电力线点并模拟出完整电力线,自动导线分类与手动导线分类垂直距离相差0.144 m。通过计算电力线与电力线保护区范围内的物体欧式距离,将计算的结果与电力线安全规范比较得到树障点或预警点等信息,极大地提高了导线拟合以及树障点位置信息。

Reference (11)

Catalog

    /

    DownLoad:  Full-Size Img  PowerPoint
    Return
    Return