


-
地球表面71%的面积是海洋,而海洋中最常见的一种现象就是波浪,波浪是岸滩演变、海港和其他海洋工程最重要的动力因素和作用力[1]。国内外研究学者和工程技术人员始终都在对其进行研究,其中现场原型观测是最重要的手段之一,伴随着波浪观测仪器的技术水平提升,该方法也变得越来越重视。
近年来,已有很多研究学者对广东沿海的实测波浪进行了研究,例如,李志强等[2]利用粤东遮浪海洋站3a的波浪观测资料,对红海湾的波侯进行分析;黎维祥等[3]根据平海站、田尾角站和海门站1a的近岸实测波浪资料,对粤东不同海域的波浪特性进行对比分析;尹毅等[4]根据珠江口1a的实测海浪资料,对海浪的基本要素、大浪过程以及与热带气旋活动的关系进行统计分析。但是,以上文献的波浪实测资料均是从离岸距离很近的岸边获得,不能代表深水海域的波浪特性。由于广东沿海面向整个南海,常年受到季风气候和热带气旋的影响,当大浪从远海向近岸传播过程中,通过会发生一系列的变形,如:浅水变形、波浪折射、波浪绕射和波浪破碎等,所以对于近岸深水区波浪特性的研究就显得更为迫切。
本文根据粤东近岸深水区1a的现场实测波浪资料,对该海域的周年波浪特征和典型台风浪特征进行统计分析和研究。包括逐月波高与周期特征值的统计分析、平均波向季节特征、波高-周期联合分布、波浪与周期的关系以及“山竹”台风浪特征。本文研究成果可以为相关海洋工程的设计提供技术参考。
HTML
-
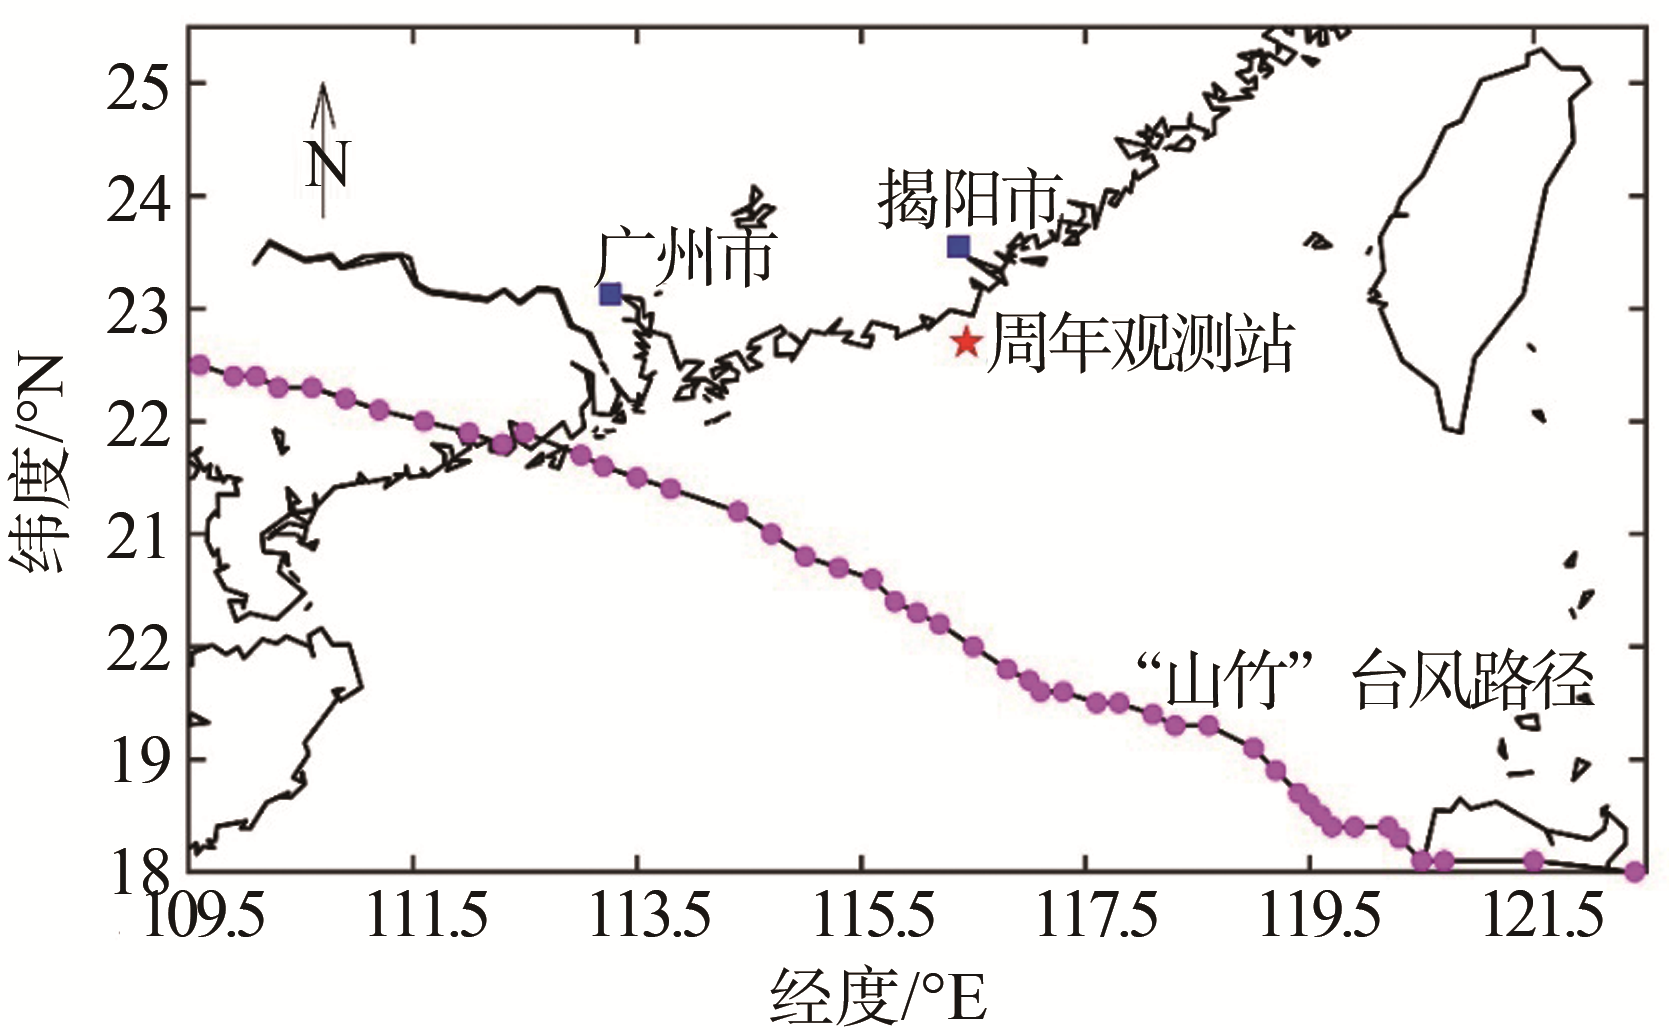
波浪资料来源于广东省惠来县外海周年波浪观测站(116°26.395',22°42.148'),位置见图1所示,离岸距离约26 km,水深为38 m。观测时间为2018年8月9日至2019年8月8日,采用挪威Nortek公司生产的AWAC“浪龙”仪器进行座底式波浪观测,仪器参数与观测频率:声学频率为600 kHz,通过声学表面波跟踪(AST)进行波浪数据处理,每天24小时连续观测,每小时记录一次,每次记录17 min(不少于100个波),采样频率为2 Hz。

Figure 1. Diagram of annual observation station location
-
采用Nortek公司Storm软件进行原始数据预处理,再对预处理过后的波浪要素进行统计分析,数据完整率达到98.26%,数据完整率较高,可以较好地对该海域周年波浪特征进行分析和研究。本文波浪要素符号说明:Hs为有效波高;Hmax为最大波高;Hmean为平均波高;TP为谱峰周期;Tmax为最大周期;Tmean为平均周期。
-
表1给出了周年观测期间各月和全年的部分波浪要素统计数据,由表可知,全年Hs平均值为1.52 m,Hmax平均值为2.40 m,Hs和Hmax最大值分别为9.38 m和15.97 m,最大值均发生在台风“山竹”影响期间;Hs平均值全年各月差异不大,冬季的12月、1月和2月为全年最高的三个月,其中2月份最大,Hs和Hmax分别为2.01 m和3.41 m,主要原因为冬季受到东北季风影响,导致波高整体偏大。而春、夏季的4月、6月和7月为全年最低的三个月,其中6月份最小,Hs和Hmax分别为1.01 m和1.70 m。
波浪要素 Hs平均值/m Hs最大值/m Hmax平均值/m Hmax最大值/m Tmean平均值/s Tp平均值/s 1月 1.78 4.35 3.01 9.09 3.8 7.2 2月 1.55 3.26 1.71 3.59 3.5 6.9 3月 1.53 3.95 2.61 7.81 3.4 6.5 4月 1.23 3.93 2.04 7.78 2.9 6.1 5月 1.44 4.22 2.45 9.35 3.2 6.4 6月 1.01 1.82 1.70 3.36 2.6 5.9 7月 1.35 3.15 2.30 5.76 3.2 7.3 8月 1.56 3.06 2.48 6.08 4.0 8.0 9月 1.43 9.38 2.38 15.97 3.8 8.2 10月 1.63 5.04 2.73 8.76 3.8 7.2 11月 1.75 5.29 1.93 5.82 3.7 6.8 12月 2.01 4.44 3.41 9.67 4 7.6 全年 1.52 9.38 2.4 15.97 3.5 7.0 Table 1.
Statistical table of wave elements in each month and year -
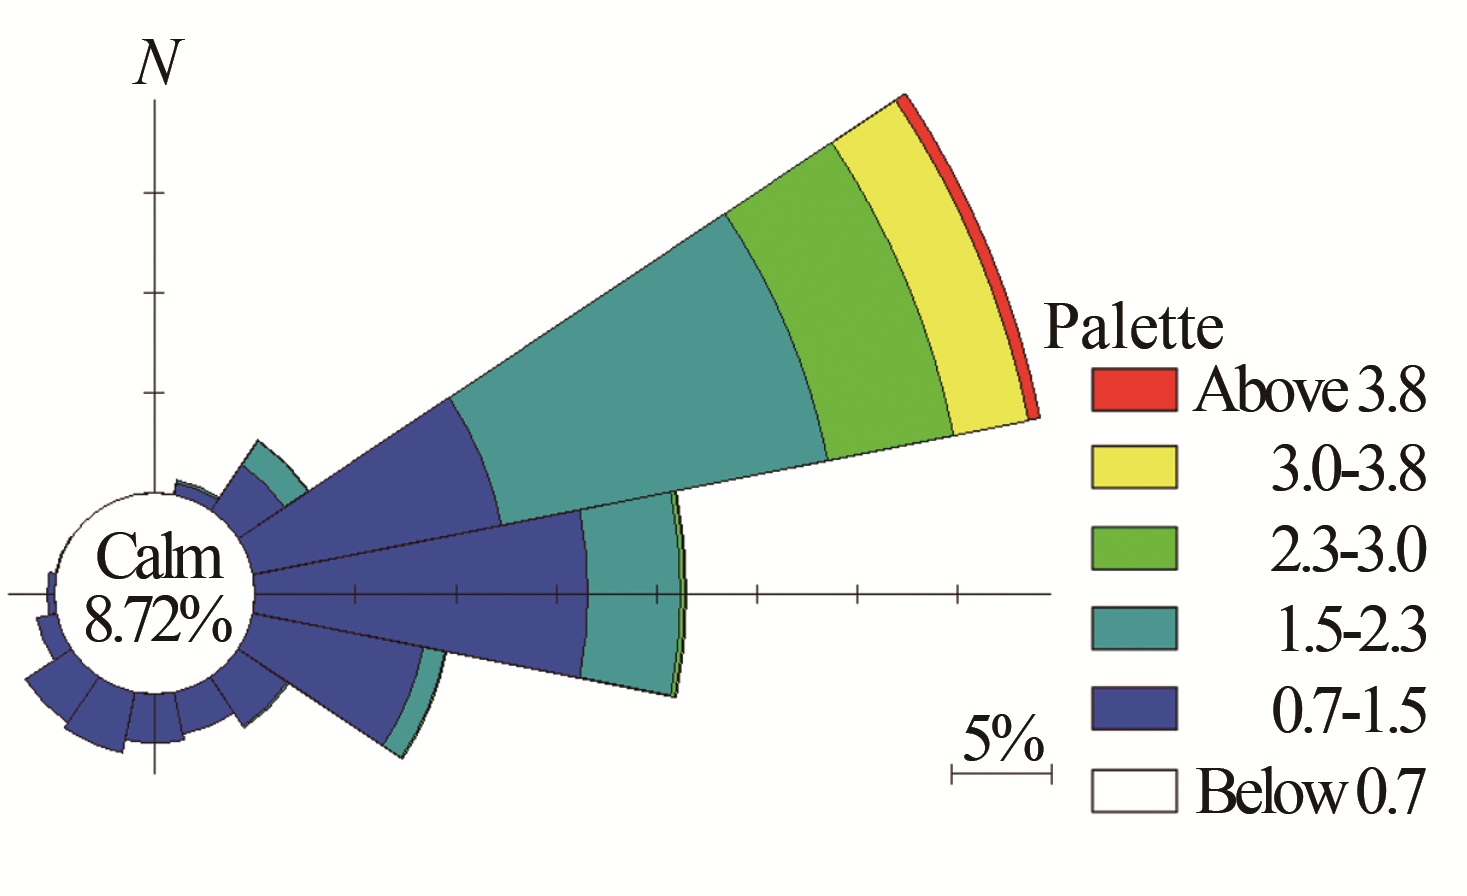
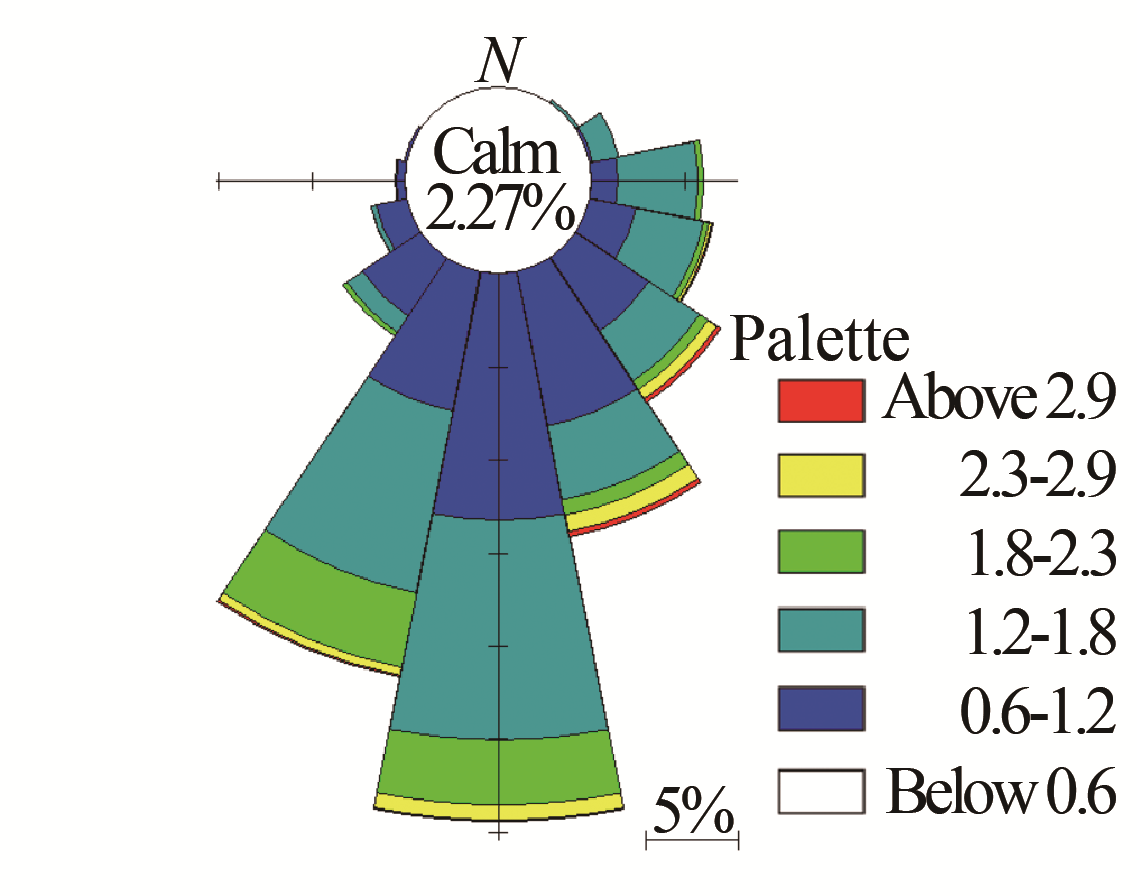
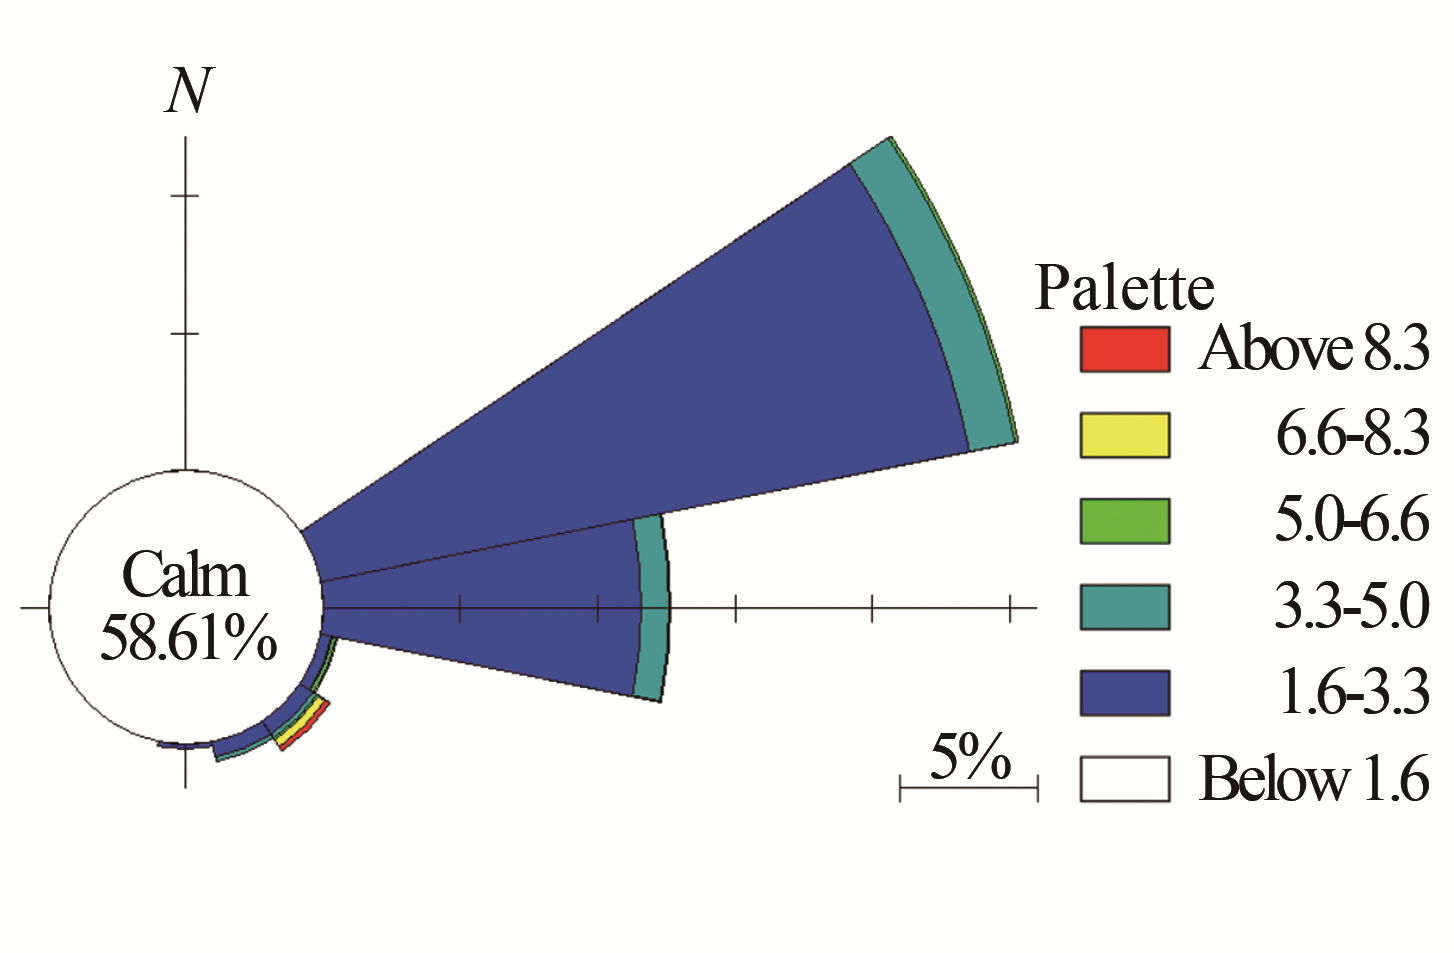
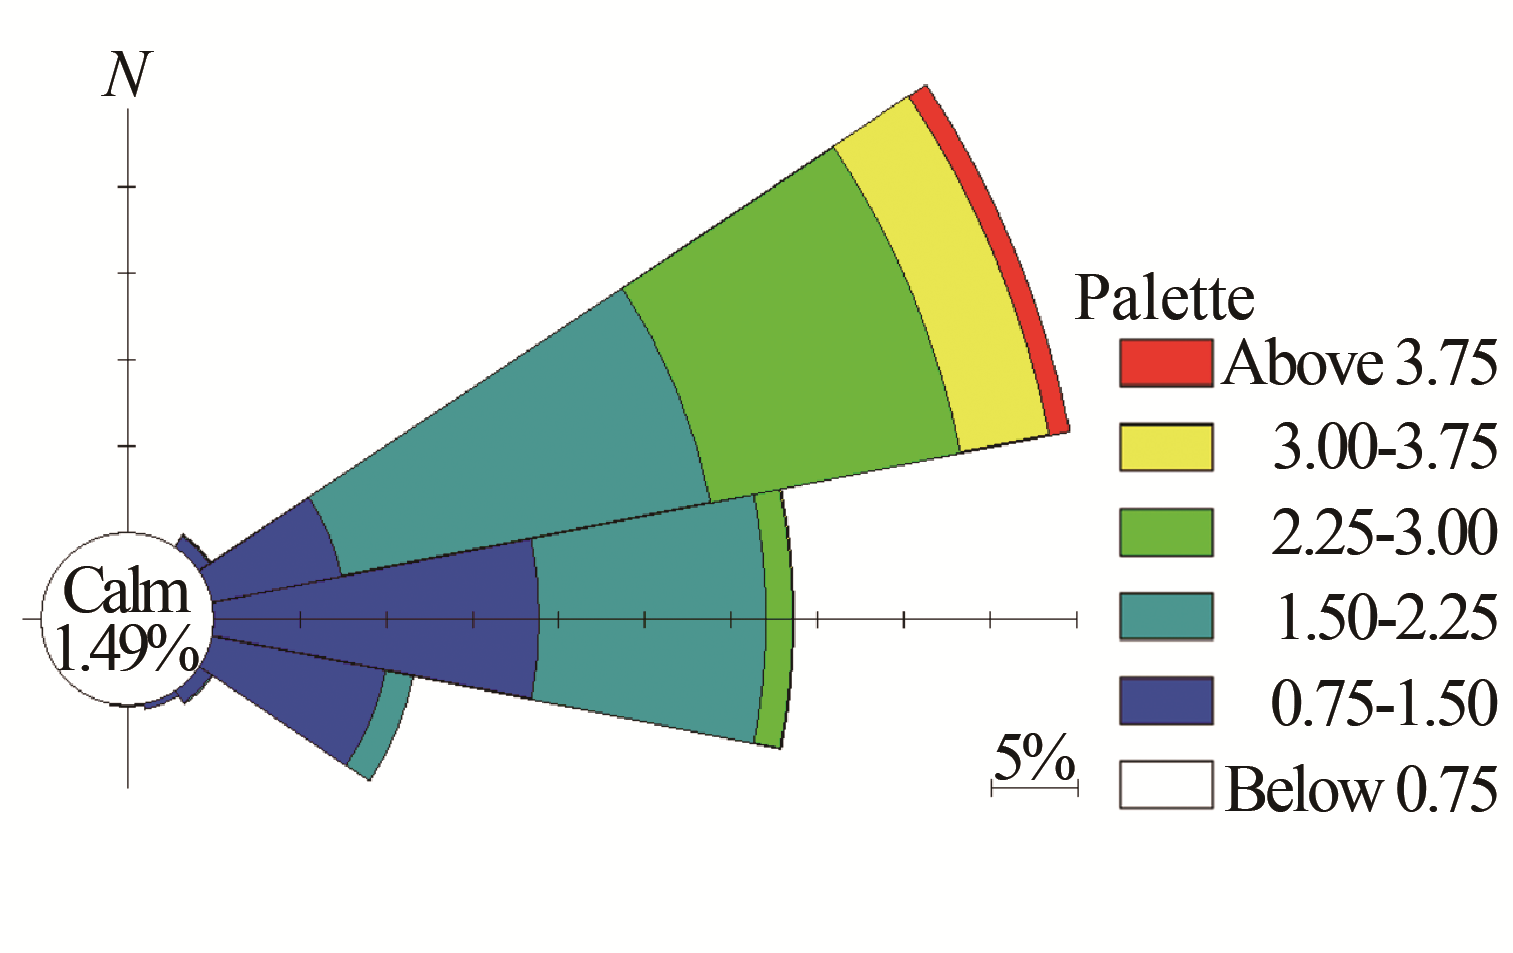
图2给出四个季节的Hs波浪玫瑰图。分析可知:春季,常浪向为ENE向,次常浪向为E向,频率分别为40.48%与23.76%,强浪向为ENE向。夏季,常浪向为S向,次常浪向为SSW向,频率分别为22.60%和18.10%,强浪向为SSE向。秋季,常浪向为ENE向,次常浪向为E向,频率分别为39.79%和34.84%,强浪向为SE向。冬季,常浪向为ENE向,次常浪向为E向,频率分别为50.84%和34.39%,强浪向为ENE向。

Figure 2. Wave rose diagram in four seasons

Figure 2. Wave rose diagram in four seasons

Figure 2. Wave rose diagram in four seasons

Figure 2. Wave rose diagram in four seasons
综上分析可知,全年常浪向为ENE向,次常浪向为E向,频率分别为33.06%与24.68%,强浪向为SE向。由于粤东近岸深水区由于受到冬季东北季风和夏季西南季风等因素影响,而且不受外围任何岛屿的掩护,呈现出典型的季节特征。
-
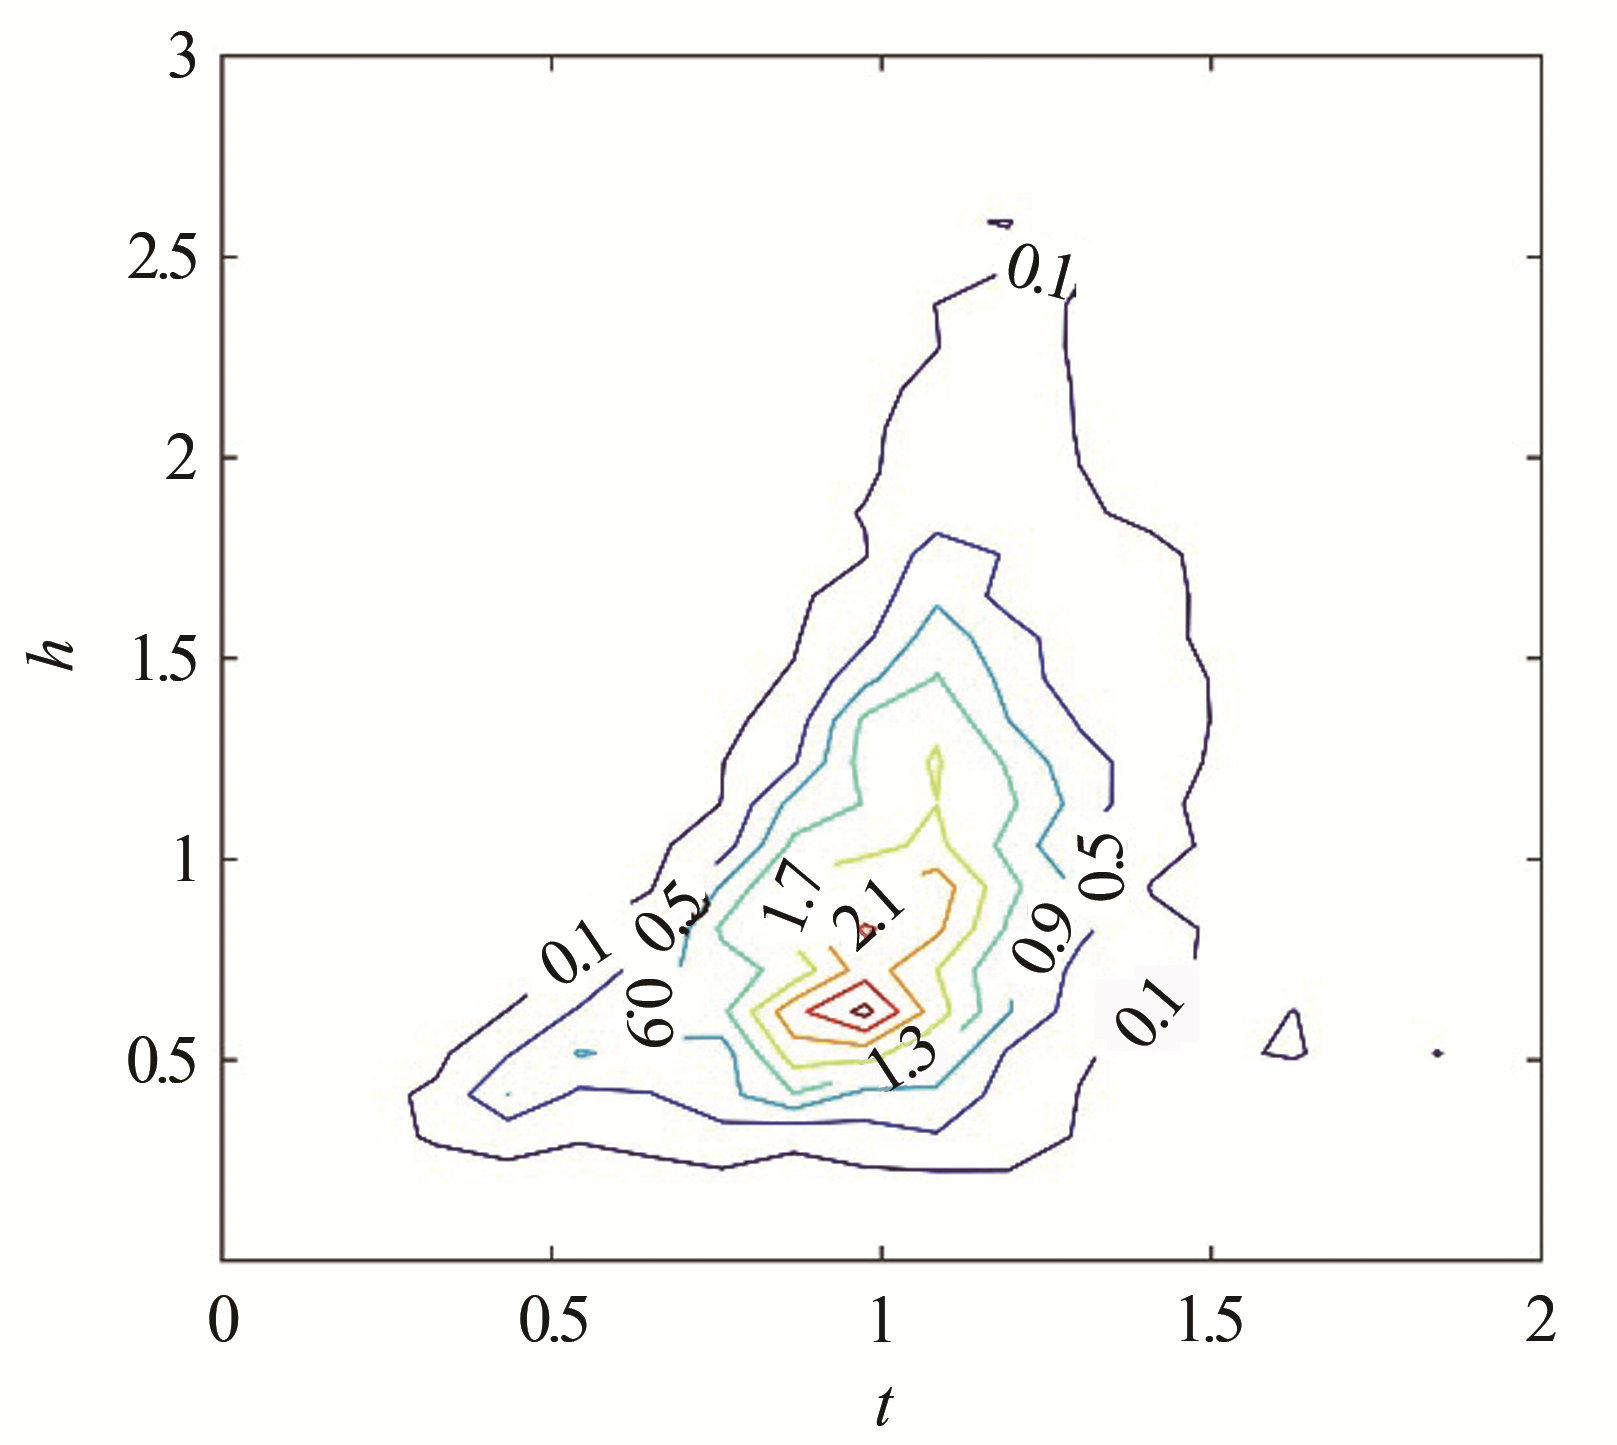
波高——周期联合分布是海洋工程设计中重要的输入参数之一,由于不同海域波浪特征的差异性,波高-周期联合分布也有所不同。根据文献[5]的研究方法,本文选取Hs-Tp联合分布进行分析,并对二者进行无因次化,令t=

Figure 3. Joint distribution of wave height and period
由图3可知,联合分布高密度区域类似一个椭圆形,其中,t主要分布在0.5~1之间,h主要分布在0.5~1.5之间。概率密度等值线最大值为2.1,说明谱峰周期主要集中在平均值附近,而有效波高集中在平均值以下。进一步分析概率密度等值线的分布范围可知,该海域主要以风浪成分为主,根据台风“山竹”期间的实测数据,有效波高与谱峰周期虽然都很大,但是其概率密度值太小,图3中并未表现出来,后续对台风“山竹”期间的波高和周期特征进行单独分析。
-
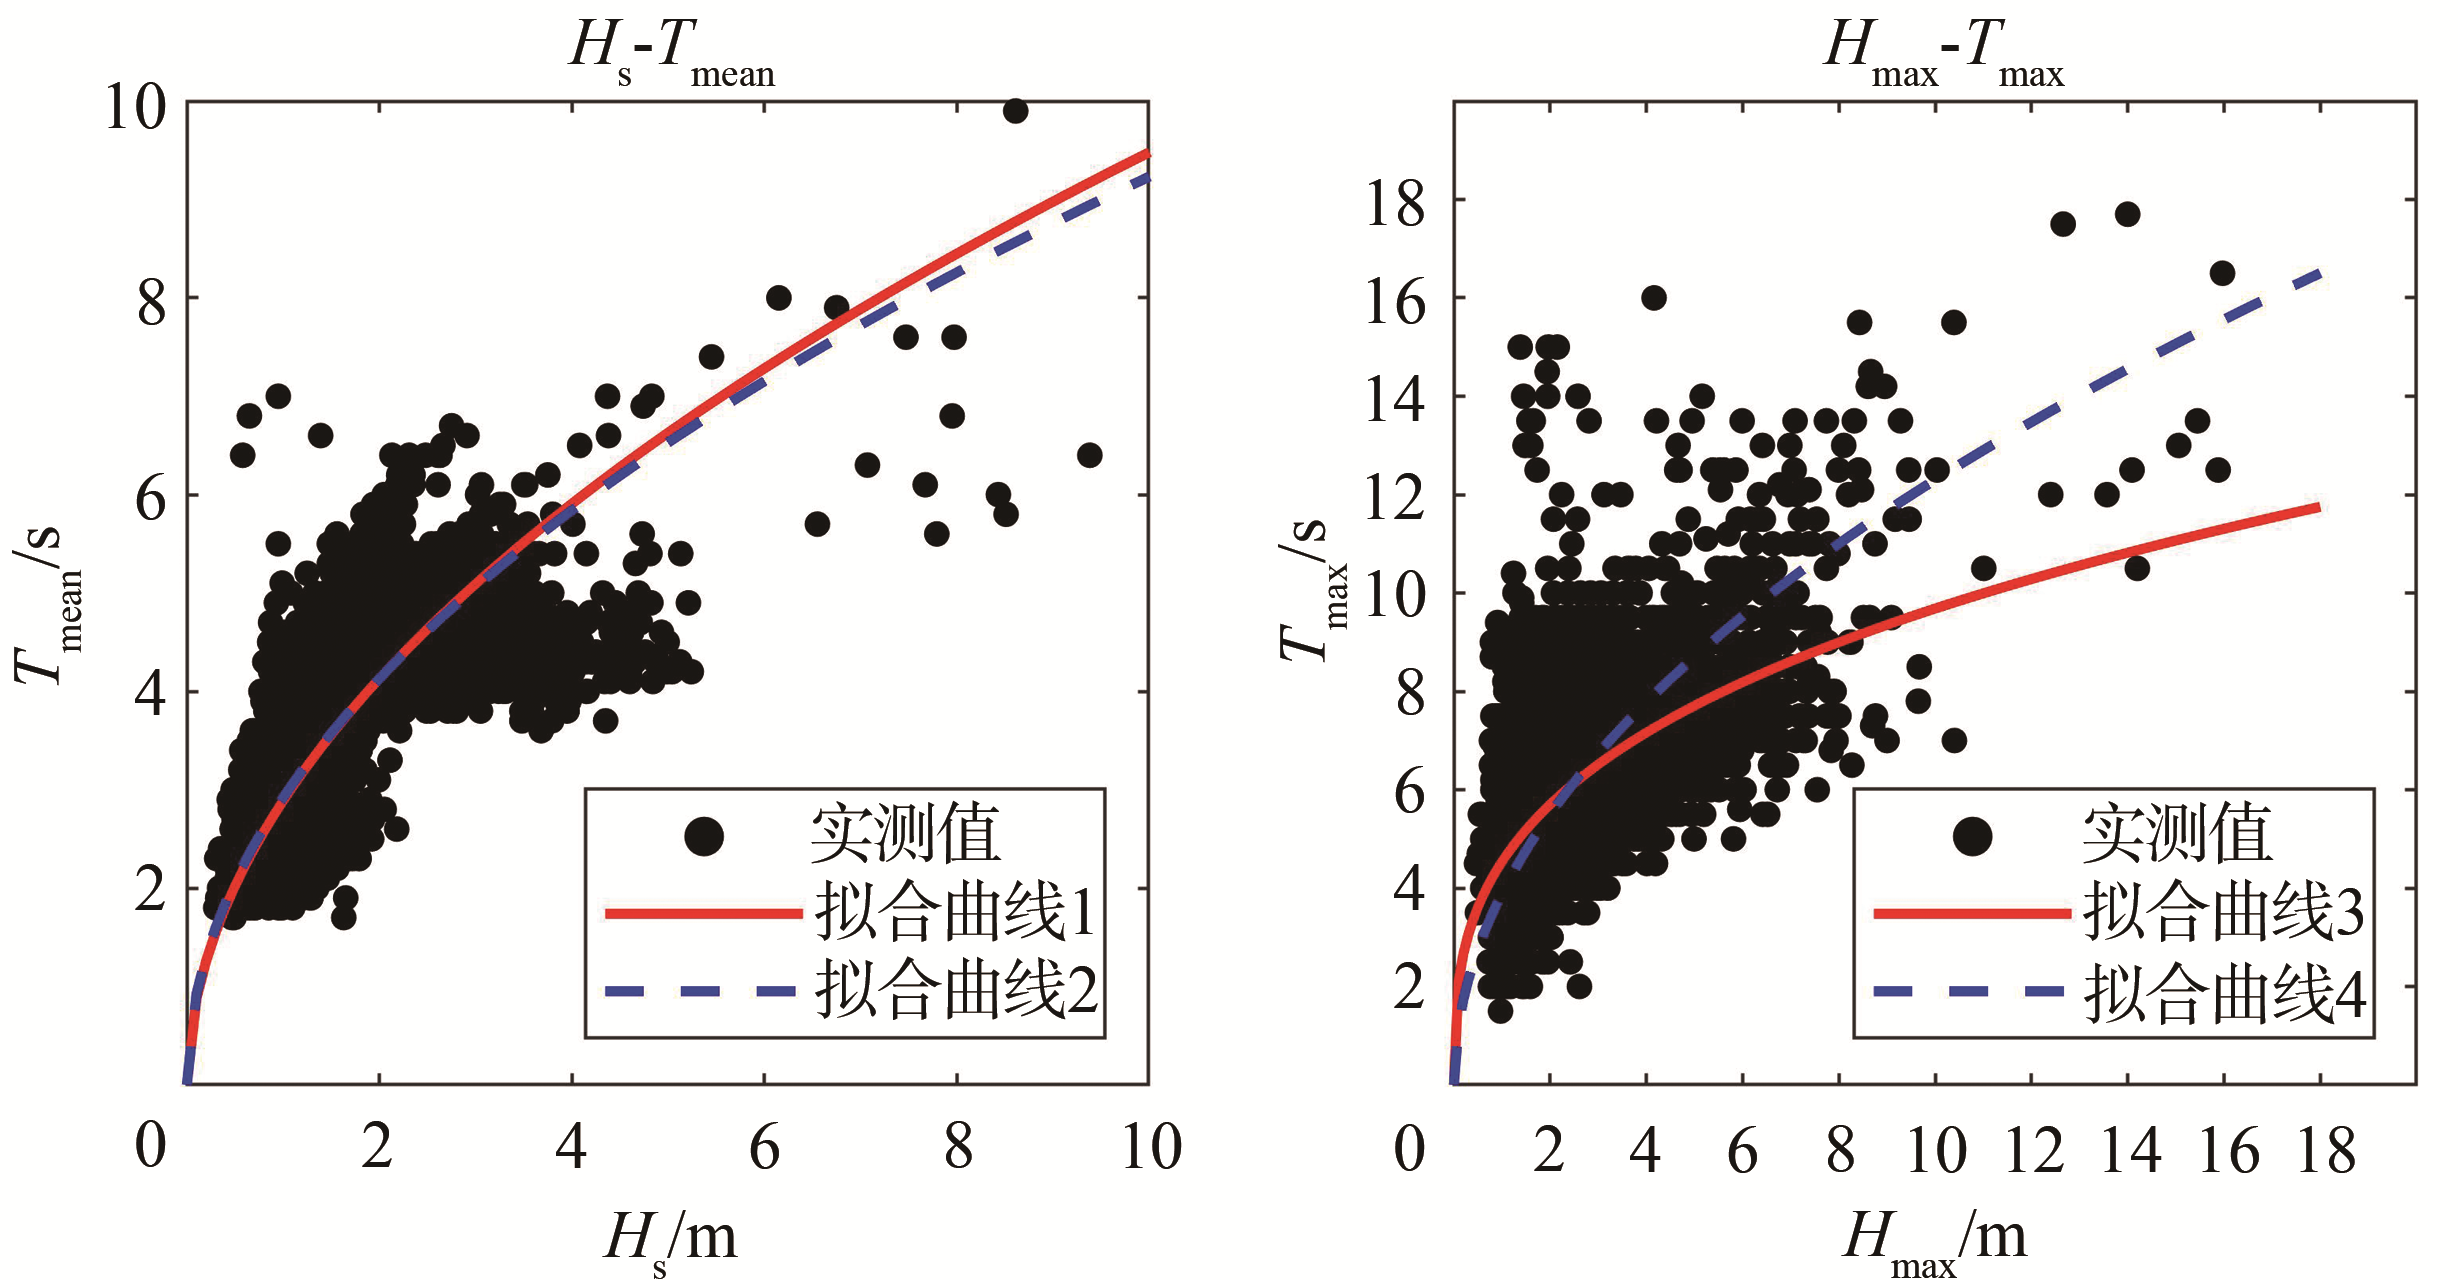
由于波高与周期之间并不是简单的线性关系,从而导致其是海洋工程研究领域的难点之一。在不同重现期设计波要素推算时,尤其是近岸波浪模型的计算,不同尺度模型进行嵌套时,不同重现期波高对应周期的计算通常会失真,所以有必要对二者的关系进行研究分析。
在“港口与航道水文规范”[6]中有相关规定:所在海域波浪以风浪为主时,可以由风浪波高和周期的相关关系推算该设计波高对应的周期;李志强等[2]也对粤东海域遮浪站的波高与周期关系进行了研究,提出两个关系:
本文针对周年波高和周期数据进行拟合,得出二者的经验系数,图4分别给出Hs-T与Hmax-Tmax的拟合曲线,拟合曲线1为:

Figure 4. The relationship between wave height and wave period
-
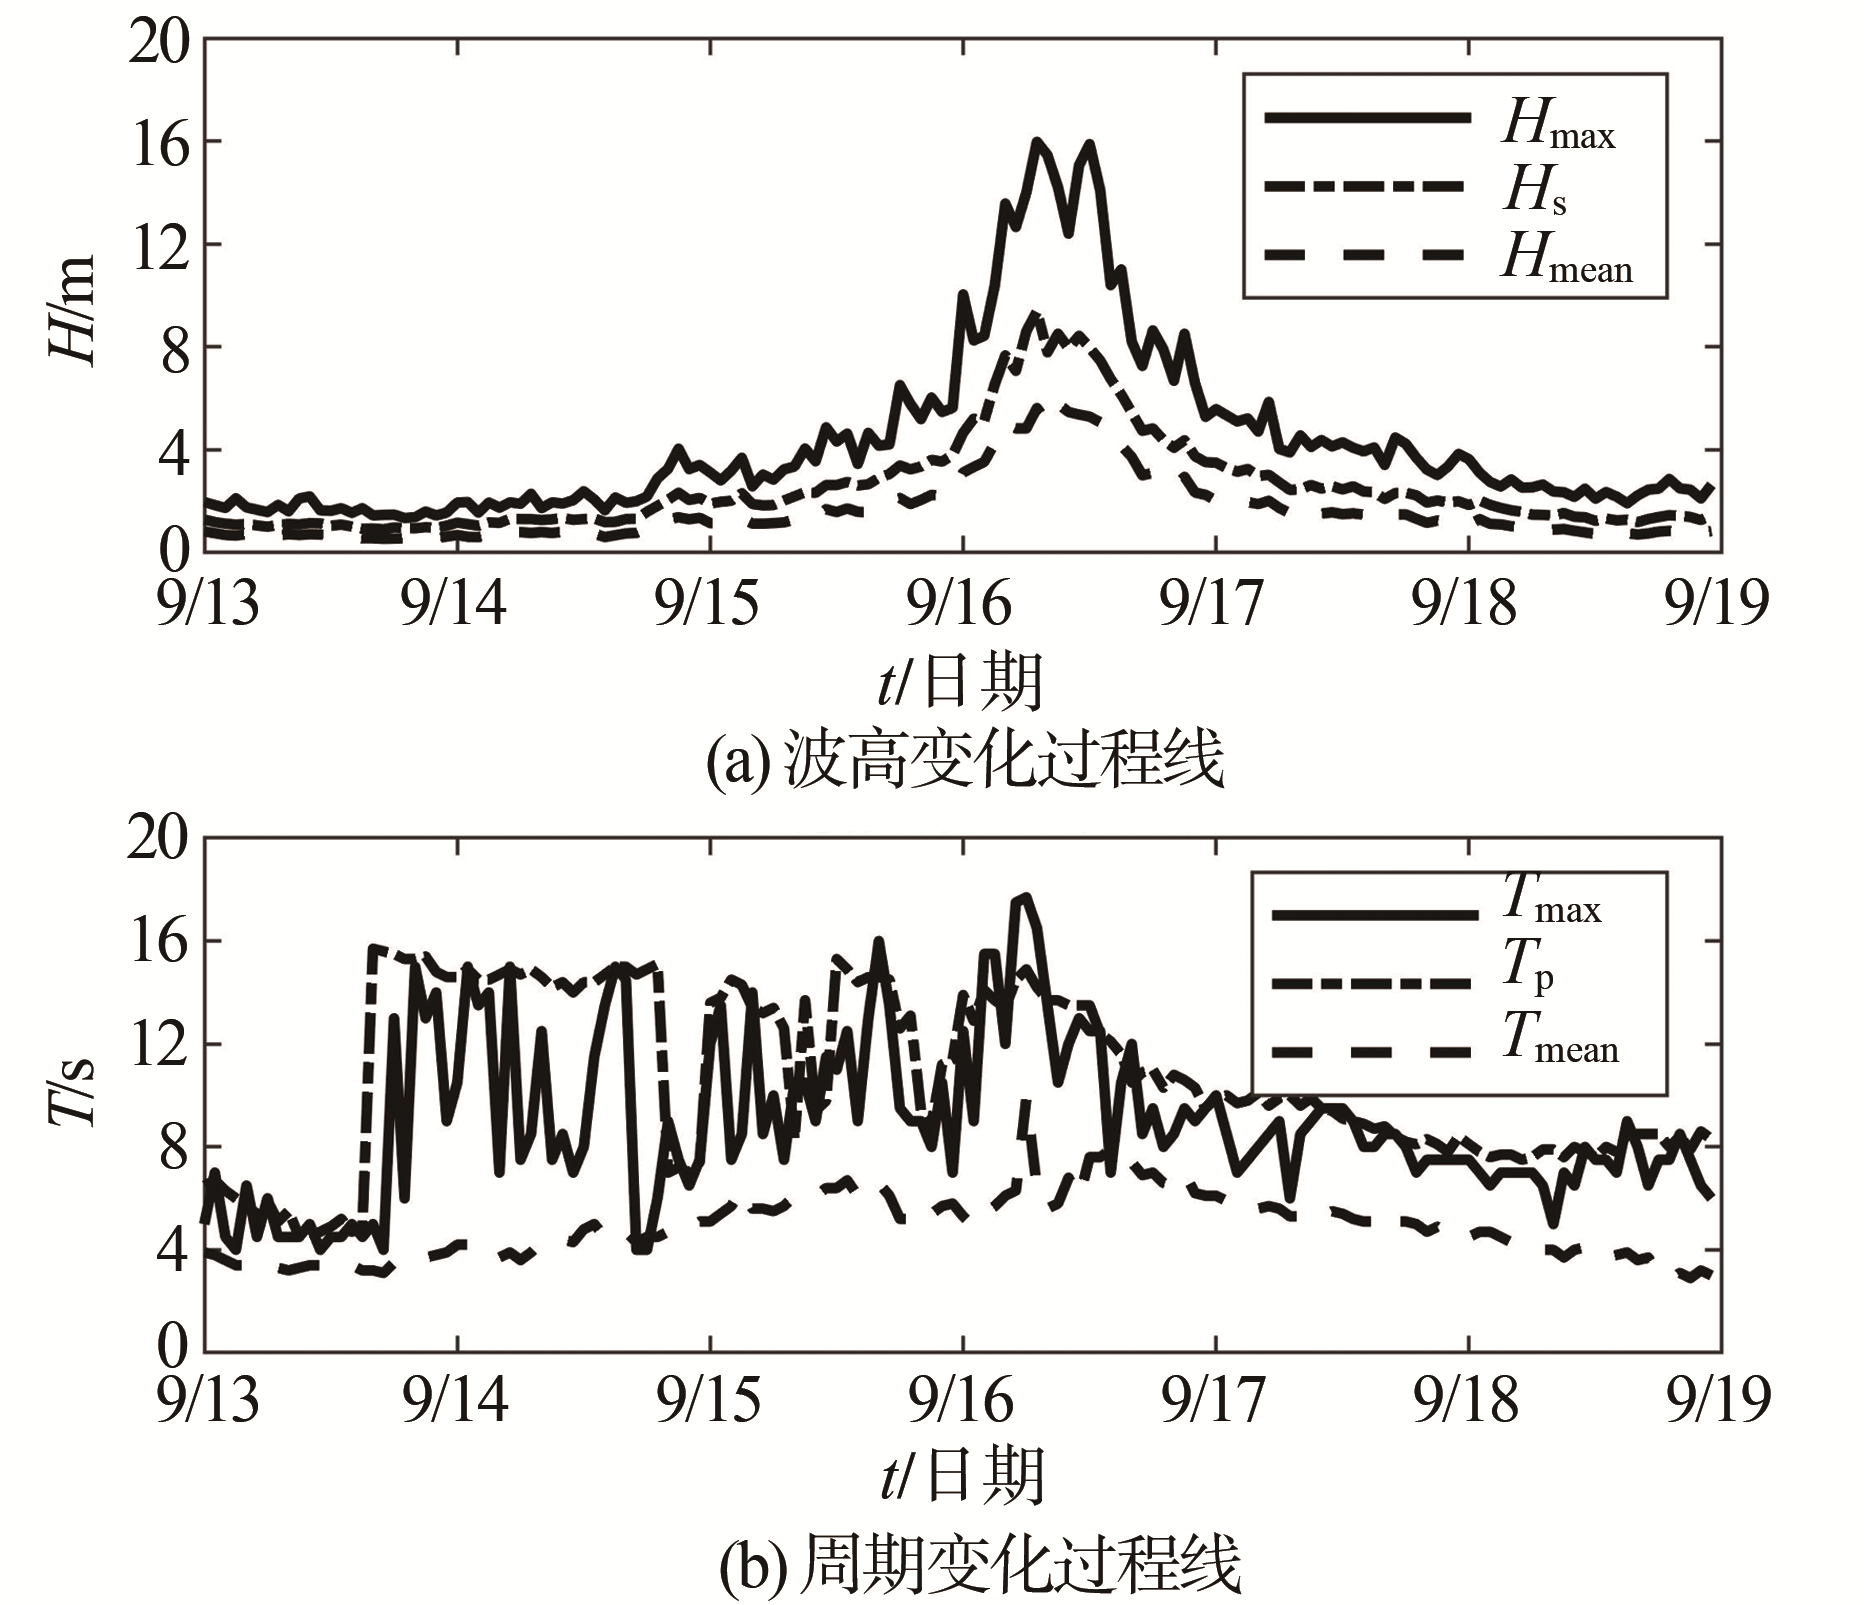
周年观测期间记录的最大一场台风浪过程是台风“山竹”造成的,图5给出了台风期间的波高和周期变化过程线,台风移动路径见图1。

Figure 5. Measured wave height and period during typhoon mangkhut
由波高变化可知,台风“山竹”引起的大浪于9/14 18:00开始影响观测海域,9/16 7:00仪器记录到本次台风过程的Hmax、Hs和Hmean,分别为15.97 m、9.38 m和5.62 m。9/16 10:00时Hmax出现一个波谷,随着台风的不断移动,Hmax又出现一个波高增大的过程,最后波高逐渐下降至正常状态。
由周期变化可知,9/13 16:00就开始记录到大周期波浪,Tmax和Tp都达到14 s以上,说明外海台风引起的涌浪开始影响观测海域。9/14 20:00时Tp开始出现较大波动,此时台风外围风圈开始影响观测站位置,从波高的变化过程也可得出相同结论。台风期间观测到Tmax、Tp和Tmean的最大值分别为17.7 s、15.3 s和9.9 s。
-
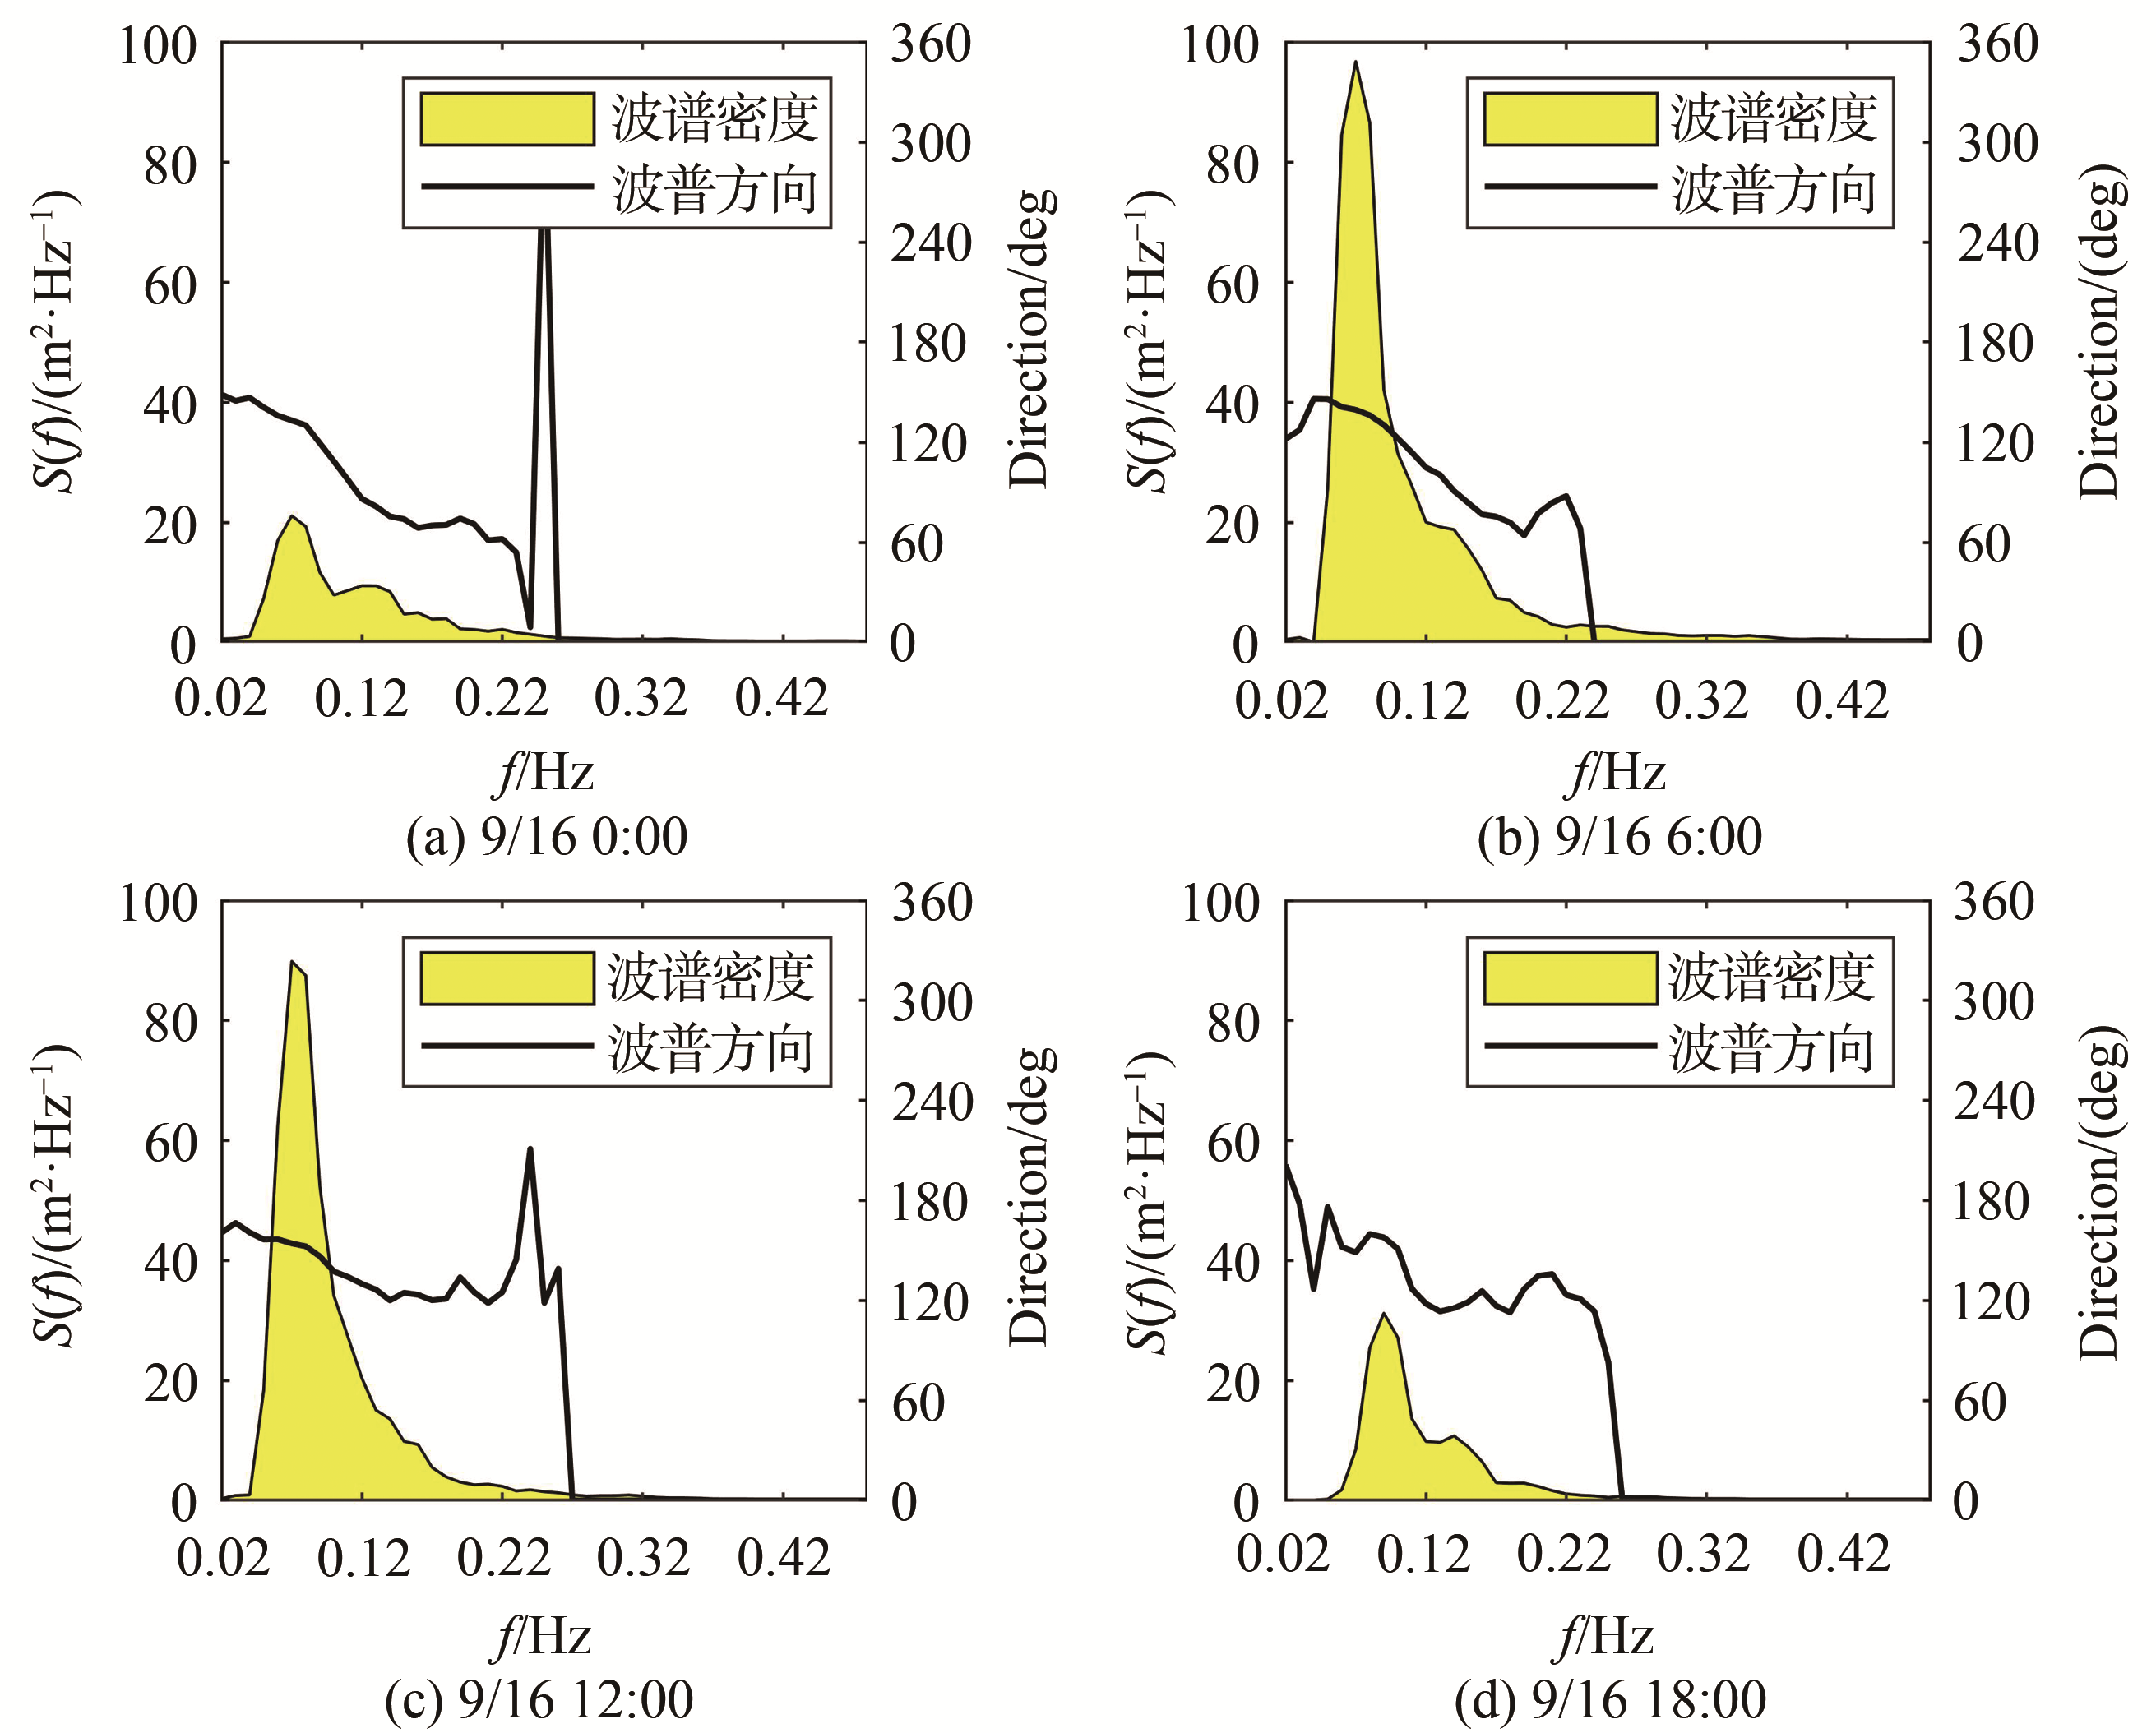
海浪谱可以描述海浪的内部结构,说明内部各部分之间的相互关系[9],从能量角度反映波能在频率和方向上的分布,而根据实测台风浪数据进行波谱分析意义更大,为进一步研究台风浪的内部特征提供帮助。
图6给出了台风“山竹”大浪影响最大时段具有代表性的4个时刻实测波浪频谱,分别是9/16 0:00、6:00、12:00和18:00,通过4个时刻的波浪谱对比可知,谱峰值经历了一个从成长到消退的过程。台风影响期间的谱峰值很大,最大值出现9/16 6:00,为96.74 m2/Hz,谱峰频率为0.07 Hz。谱型均为单峰谱,主峰频率宽度较窄,范围为0.05 Hz~0.20 Hz。波谱方向主要为E~SSE向。

Figure 6. Measured wave spectrum during typhoon Mangkhut
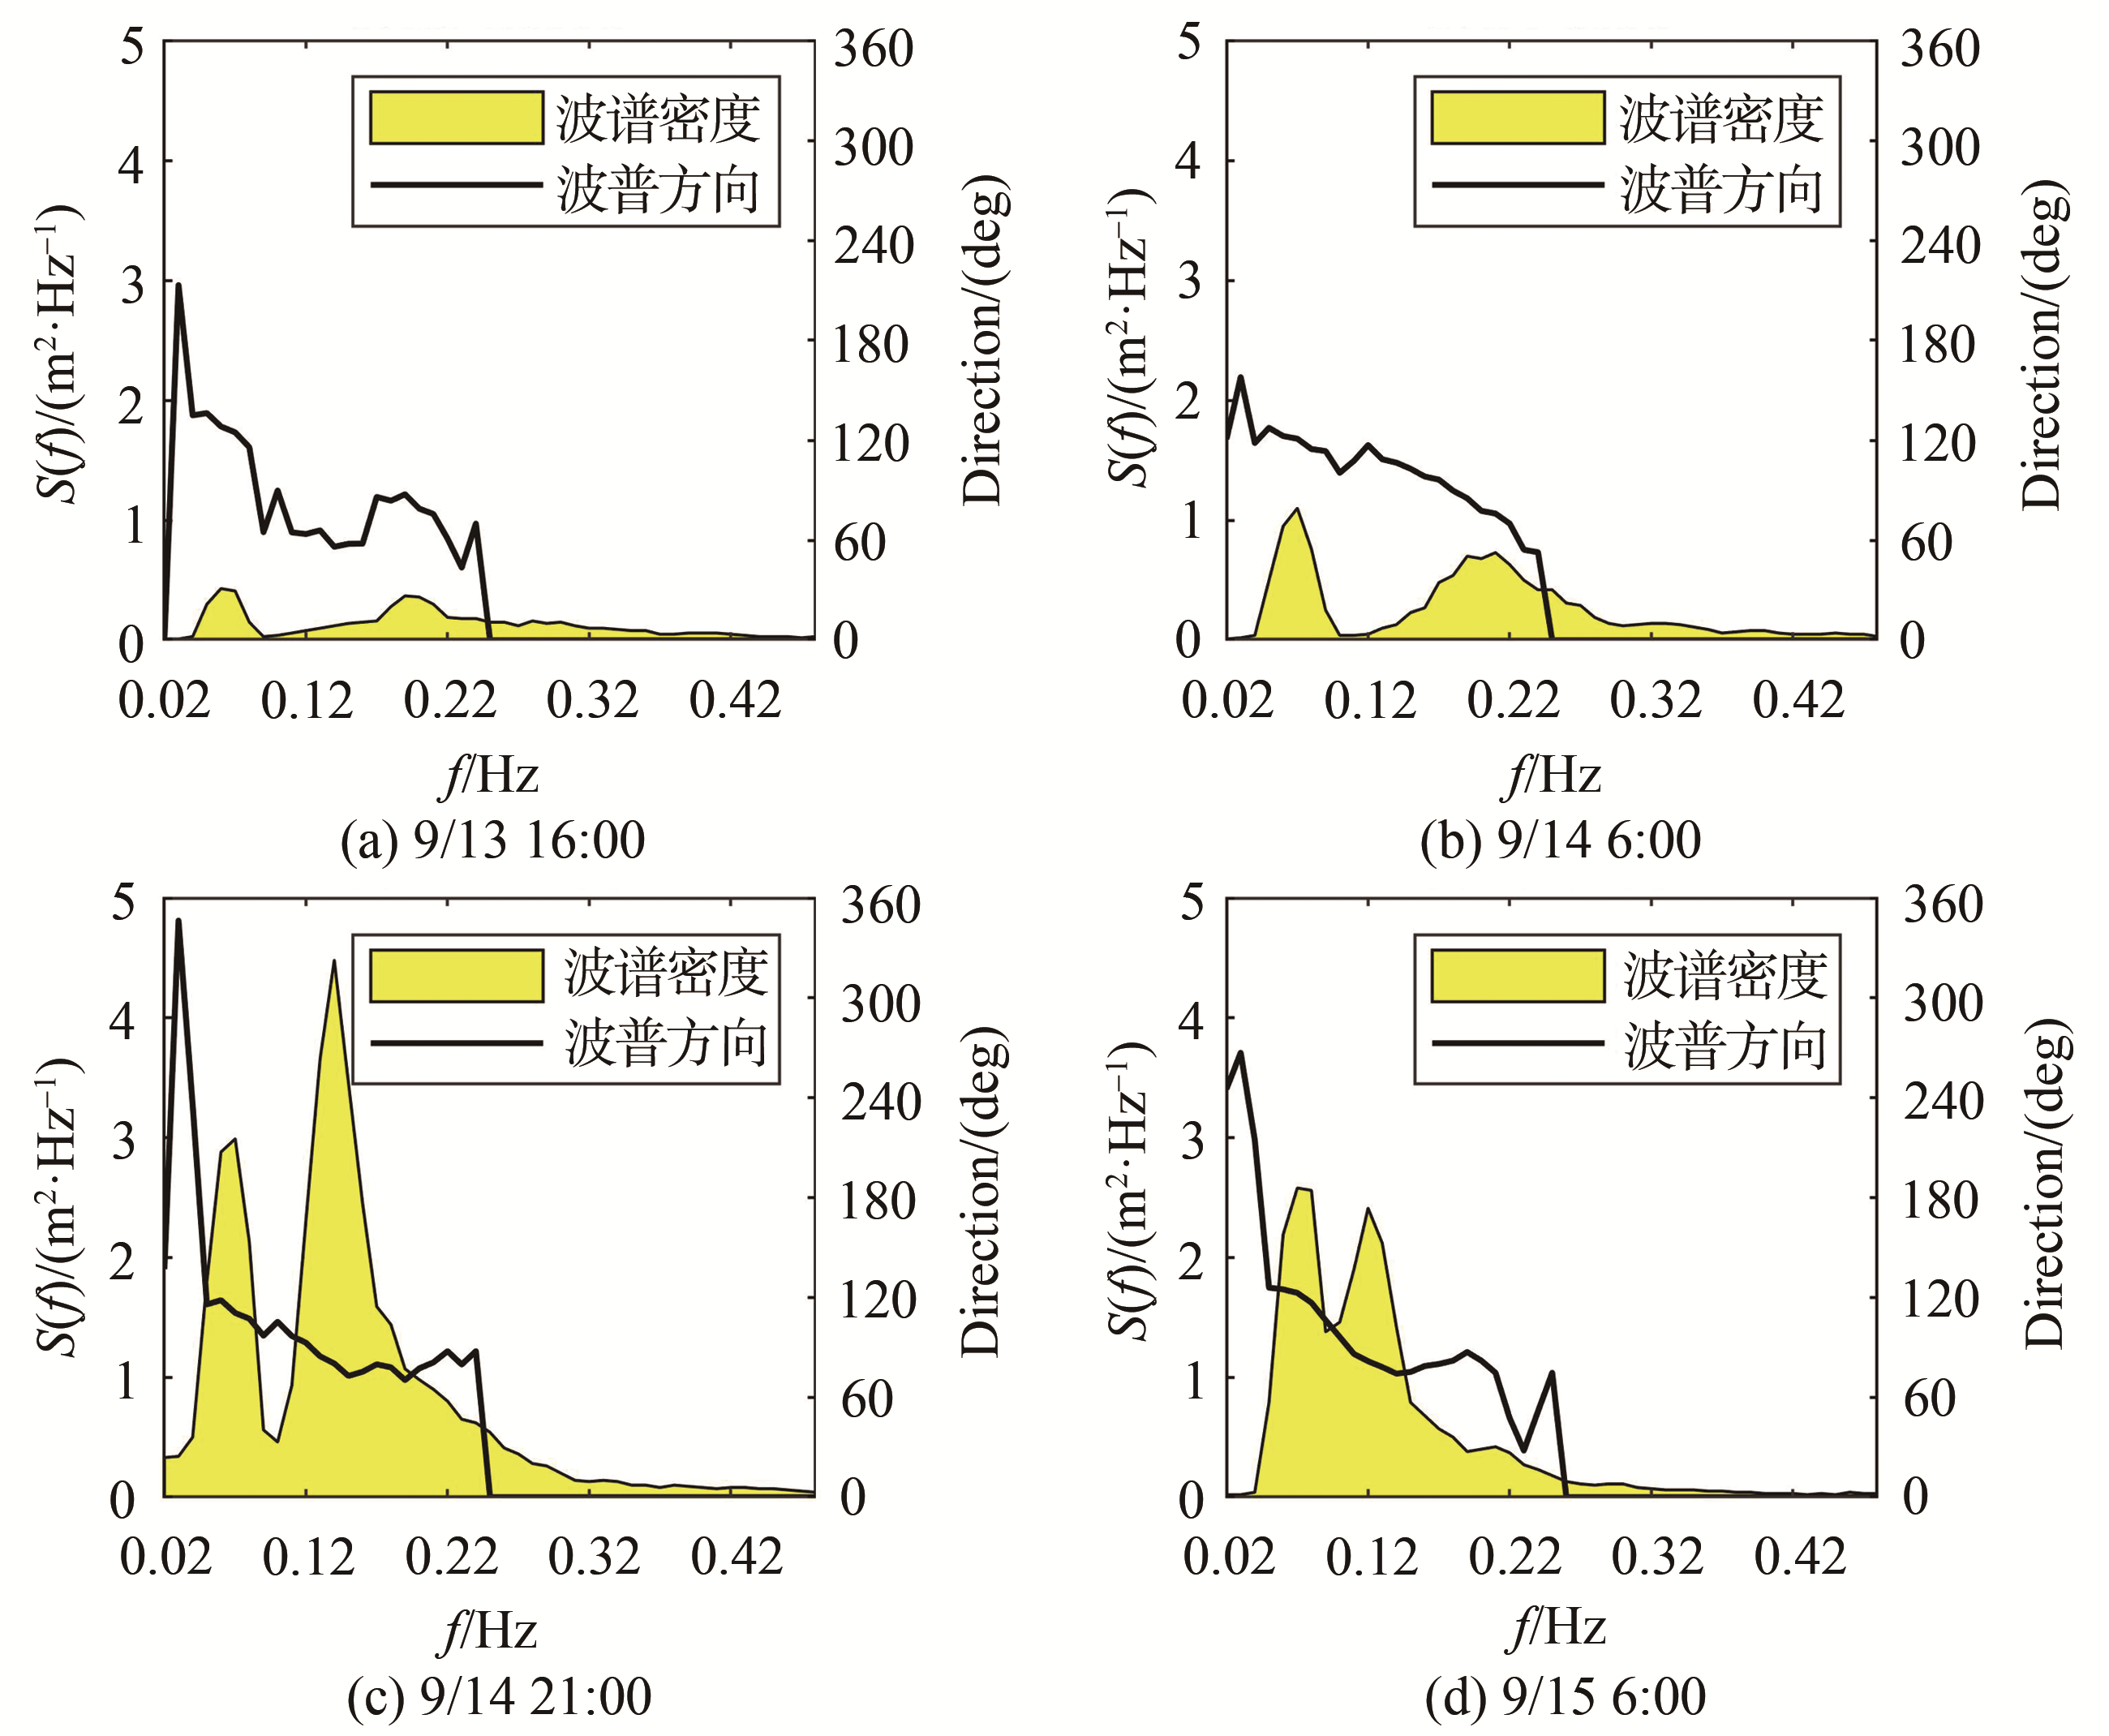
图7给出了台风“山竹”大浪影响之前具有代表性的4个时刻实测双峰谱,分别为9/13 16:00、9/14 6:00、9/14 21:00和9/15 6:00,通过4个时刻波浪谱对比分析,可以很明显看出双峰谱的形成和演变过程。从谱峰值和谱峰频率的变化可知,在台风大浪影响之前,谱峰值的变化为低—高—低,双峰的谱峰频率差逐渐缩小,说明台风浪的谱型是一个实时变化的,从双峰型向单峰型逐渐演变的过程。谱型变化也说明了台风浪类型为混合浪,并且是以涌浪为主的风涌混合浪。根据杨生强[10]南海北部的三场实测台风浪谱分析的成果表明:随着海况的恶劣程度增加,谱峰频率向左移动,能量往低频方向集中。消衰过程中,谱峰值逐渐减小,峰频有向高频推移的趋势;并且进一步对实测数据进行JONSWAP谱的参数拟合。通过与本文“山竹”台风浪谱分析的对比可知,粤东海域过境台风浪的谱型和谱峰频率的变化规律基本一致,但是由于台风强度和观测位置的不同,谱峰值和波谱方向会有所差异。

Figure 7. Measured wave double-peaked spectrum during typhoon Mangkhut
2.1 逐月波浪要素特征值
2.2 波向季节特征
2.3 波高——周期联合分布
2.4 波高与周期的关系
2.5 典型台风浪分析
2.5.1 实测台风浪过程
2.5.2 台风浪谱分析
-
本文根据粤东近岸深水区1a的现场实测波浪资料,对该海域的周年波浪特征和典型台风浪特征进行统计分析和研究。得到如下结论:
1)全年Hs平均值为1.52 m,Hmax为15.97 m,全年12月、1月和2月的Hs平均值最大,4月、6月和7月为全年最低,波高与周期最大值均由“山竹”台风浪造成。
2)观测海域主要受季风季候和热带气旋等因素影响,全年常浪向和强浪向分别为ENE向和SE向。
3)全年波浪类型主要以风浪成分为主,对波高与周期的相关关系进行拟合。
4)根据“山竹”台风浪实测数据,波高和周期都有显著的升高和降低过程。通过海浪谱分析,台风期间经历了从双峰谱向单峰谱的演变,说明台风期间的波浪类型主要为风涌混合浪,谱峰值于9月16日6时达到最大值96.74 m2/Hz,谱峰频率为0.07 Hz。

 DownLoad: