• Peer Review
  • Non-profit
  • Global Open Access
  • Green Channel for Rising Stars
Volume 7 Issue S2
Jan.  2021
Turn off MathJax
Article Contents

Xiangsheng LEI, Zidong WU, Ping DONG, Hongzhou JIA. Method of Demand Response Potential Assessment Based on  Two-stage Cluster Analysis[J]. SOUTHERN ENERGY CONSTRUCTION, 2020, 7(S2): 1-10. doi: 10.16516/j.gedi.issn2095-8676.2020.S2.001
Citation: Xiangsheng LEI, Zidong WU, Ping DONG, Hongzhou JIA. Method of Demand Response Potential Assessment Based on  Two-stage Cluster Analysis[J]. SOUTHERN ENERGY CONSTRUCTION, 2020, 7(S2): 1-10. doi: 10.16516/j.gedi.issn2095-8676.2020.S2.001

Method of Demand Response Potential Assessment Based on  Two-stage Cluster Analysis

doi: 10.16516/j.gedi.issn2095-8676.2020.S2.001
  • Received Date: 2020-06-30
  • Rev Recd Date: 2020-08-24
  • Publish Date: 2021-01-08
  •     Introduction     With the development of metering and communication technology, the basic hardware conditions for implementing demand response have been met, and the implementation of demand response projects has been put on the agenda. The selection of pilot regions for demand response implementation requires an assessment of the region's demand response potential.    Method   In order to solve the problem which the price elasticity coefficient was only used in the demand response potential evaluation of general load at this stage, and the accurate data of price elasticity coefficient was difficult to obtain, this paper innovatively designed a demand response potential evaluation method based on two-stage clustering analysis. This method fully considered the user's suitability and the characteristics of the user process/equipment, which mainly affect the demand response potential.    Result   A case study of 386 users in a city in Guangdong has been carried out, and the average demand response potential for the 250 hours with a higher load in the city is 3.2% of the city's highest load.    Conclusion   Compared with the current demand response of the various electricity markets in the United States, it is found that the results of this evaluation method are reasonable and have certain practical value.
  • [1] 宗柳,李扬,王蓓蓓. 计及需求响应的多维度用电特征精细挖掘 [J]. 电力系统自动化,2012,36(20):54-58.

    ZONGL,LIY,WANGB B. Fine-mining of multi-dimension electrical characteristics considering demand response [J]. Automation of Electric Power Systems,2012,36(20):54-58.
    [2] 钱程. 基于用户用电行为建模和参数辨识的需求响应应用研究 [D]. 南京:东南大学,2016.

    QIANC. Research on the application of demand response based on modeling of electrical behavior and parameter identification [D]. Nanjing:Southeast University,2016.
    [3] KWACJ,FLORAJ,RAJAGOPALR. Household energy consumption segmentation using hourly data [J]. IEEE Transactions on Smart Grid,2014,5(1):420-430.
    [4] 周谢. 电力负荷特性指标及其内在关联性分析 [D]. 长沙:长沙理工大学,2013.

    ZHOUX. The analysis on power load characteristics index and its intrinsic correlation relationship [D]. Changsha:Changsha University of Science&Technology,2013.
    [5] 刘国辉,赵佳,孙毅. 基于模糊优化集对分析理论的需求响应潜力评估 [J]. 电力需求侧管理,2018,20(6):1-5.

    LIUG H,ZHAOJ,SUNY. Potential evaluation of demand response based on fuzzy optimization of set pair analysis [J]. power demand side management,2018,20(6):1-5.
    [6] 李亚平,王珂,郭晓蕊,等. 基于多场景评估的区域电网需求响应潜力 [J]. 电网与清洁能源,2015,31(7):1-7.

    LIY P,WANGK,GUOX R,et al. Demand response potential based on multi-scenarios assessment in regional power system [J]. power system and clean energy,2015,31(7):1-7.
    [7] 任炳俐,张振高,王学军,等. 基于用电采集数据的需求响应削峰潜力评估方法 [J]. 电力建设,2016,37(11):64-70.

    RENB L,ZHANGZ G,WANGX J,et al. Assessment method of demand response peak shaving potential based on metered load data [J]. Electric Power Construction,2016,37(11):64-70.
    [8] 孙彦萍,李虹,杨文海,等. 基于SOM需求响应潜力的居民用户优化聚合模型 [J]. 电力建设,2017,38(7):25-33.

    SUNY P,LIH,YANGW H,et al. Optimized aggregation model for resident users based on SOM demand response potential [J]. Electric Power Construction,2017,38(7):25-33.
    [9] 王蓓蓓,朱峰,嵇文路,等. 中央空调降负荷潜力建模及影响因素分析 [J]. 电力系统自动化,2016,40(19):44-52.

    WANGB B,ZHUF,JIW L,et al. Load cutting potential modeling of central air-conditioning and analysis on influencing factors [J]. Automation of Electric Power Systems,2016,40(19):44-52.
    [10] CHUANL,UKILA. Modeling and validation of electrical load profiling in residential buildings in Singapore [J]. IEEE Transactions on Power Systems,2015,30(5):2800-2809.
    [11] ALSTONEP,POTTERJ,PIETTEM A,et al. California demand response potential study:charting California's demand response future [R]. Sacramento: California Public Utilities Commission,2016.
    [12] STARKEM,ALKADIN,MAO. Assessment of industrial load for demand response across US regions of the western interconnect [R]. Oak Ridge,TN:Oak Ridge National Lab. 2013.
    [13] ALSTONEP,POTTERJ,PIETTEM,et al. 2025 California demand response potential study final report on phase [R]. Berkeley: Lawrence Berkeley National Laboratory,2017.
    [14] Mac KayD J C. Information theory,inference and learning algorithms [M]. Cambridge: Cambridge University Press,2003.
    [15] CHICCOG.Overview and performance assessment of the clustering methods for electrical load pattern grouping [J]. Energy,2012,42(1):68-80.
    [16] 国家市场监督管理总局. 国民经济行业分类:GB/T 4754—2017 [S].北京:国家统计局,2017.

    State Administration of Market Supervision and Administration. National economy industry classification :GB/T 4754—2017 [S]. Beijing: National Bureau of Statistics,2017.
    [17] U.S. EIA. Commercial buildings energy consumption survey:trends in lighting in commercial buildings [EB/OL]. (2017-05-17) [2020-06-30]. https://www.eia.gov/consumption/commercial/reports/2012/lighting/.
    [18] LODGINGS. Here's where hotels spend the most on energy [EB/OL]. (2018-04-24) [2020-06-30]. https://lodgingmagazine.com/where-hotels-spend-most-energy.
    [19] LEE M,ASLAMO,FOSTERB,et al. Assessment of demand response and advanced metering [R]. Washington D.C.: Federal Energy Regulatory Commission,Tech. Rep., 2018.
    [20] 张琳,许可,黄耀,等. 基于模糊聚类的园区配网峰谷特性和潜力分析研究 [J]. 南方能源建设,2020,7(1):27-32.

    ZHANGL,XUK,HUANGY,et al. Analysis of potential shifting and filling potential of campus distribution network based on fuzzy clustering [J]. South Energy Construction,2020,7(1):27-32.
  • 通讯作者: 陈斌, bchen63@163.com
    • 1. 

      沈阳化工大学材料科学与工程学院 沈阳 110142

    1. 本站搜索
    2. 百度学术搜索
    3. 万方数据库搜索
    4. CNKI搜索

Figures(8)  / Tables(9)

Article Metrics

Article views(522) PDF downloads(61) Cited by()

Related

Method of Demand Response Potential Assessment Based on  Two-stage Cluster Analysis

doi: 10.16516/j.gedi.issn2095-8676.2020.S2.001

Abstract:     Introduction     With the development of metering and communication technology, the basic hardware conditions for implementing demand response have been met, and the implementation of demand response projects has been put on the agenda. The selection of pilot regions for demand response implementation requires an assessment of the region's demand response potential.    Method   In order to solve the problem which the price elasticity coefficient was only used in the demand response potential evaluation of general load at this stage, and the accurate data of price elasticity coefficient was difficult to obtain, this paper innovatively designed a demand response potential evaluation method based on two-stage clustering analysis. This method fully considered the user's suitability and the characteristics of the user process/equipment, which mainly affect the demand response potential.    Result   A case study of 386 users in a city in Guangdong has been carried out, and the average demand response potential for the 250 hours with a higher load in the city is 3.2% of the city's highest load.    Conclusion   Compared with the current demand response of the various electricity markets in the United States, it is found that the results of this evaluation method are reasonable and have certain practical value.

Xiangsheng LEI, Zidong WU, Ping DONG, Hongzhou JIA. Method of Demand Response Potential Assessment Based on  Two-stage Cluster Analysis[J]. SOUTHERN ENERGY CONSTRUCTION, 2020, 7(S2): 1-10. doi: 10.16516/j.gedi.issn2095-8676.2020.S2.001
Citation: Xiangsheng LEI, Zidong WU, Ping DONG, Hongzhou JIA. Method of Demand Response Potential Assessment Based on  Two-stage Cluster Analysis[J]. SOUTHERN ENERGY CONSTRUCTION, 2020, 7(S2): 1-10. doi: 10.16516/j.gedi.issn2095-8676.2020.S2.001
  • 随着电力市场改革的推进,需求响应作为一种电力系统的重要资源,受到人们的广泛关注。需求响应的实施推广面临着试点区域的选取,需求响应的潜力分析在决定试点区域的选取中扮演着重要作用。在需求响应潜力较高的地方开展需求响应才有可能取得较好的效果,从而有利于需求响应的推广。

    目前国内外对需求响应潜力评估的研究主要包括两种:通过负荷曲线的分析得到用户的用电特性,从而定性分析需求响应潜力的高低;通过对负荷进行建模来定量计算需求响应潜力。

    1)负荷用电特性的分析

    文献[1]从隶属维度、时间维度、响应维度三个方面评估负荷的用电特性,分别对应于对用户激励型用户潜力、价格型用户潜力的分析。文献[2]针对价格敏感型用户,及基于消费者心理学,探讨用户的电价与用电量间的关系,构建负荷的用电特性。文献[3]针对居民用户构建用电特性曲线库,居民用户每天负荷曲线可以从库中找到相应编号,然后使用熵作为评估指标来对用户用电规律性指标进行评估,规律性越强则潜力越高。文献[4]从负荷特性指标的外在影响因素及指标内在关联关系挖掘两方面对电网负荷特性作了详细分析,清晰的表示出负荷指标所代表的负荷特性。

    负荷用电特性分析主要是通过负荷曲线或相关的指标聚类分析得到。可以分析得到负荷用电模式,用电规律性以及用电量与电价间的关系等。用户用电特性的研究有助于定性评估用户是否适合参与需求响应。

    2)需求响应潜力定量评估

    文献[5]提出了一种基于层次分析法的需求响应潜力评估体系,用于解决在负荷削减量确定的情况下各主体削减量的分配问题;文献[6]价格型需求响应潜力通过价格弹性来确定,激励型需求响应通过调研统计来获得削减数据;文献[7]使用5个特性指标对用户负荷来进行聚类分析,从而选取出用户的典型负荷曲线,削减数据并给定大型中型小型工商业的一个固定的削减量来进行评估。文献[8]通过对居民中四种类型的负荷建模,以用户收益最大化来对评估居民用户的需求响应潜力;文献[9]通过对空调的详细建模,分析了空调参与需求响应的潜力;文献[10]通过对居民类进行建筑详细的建模,分析了居民类建筑参与需求响应的潜力。

    需求响应潜力的分析分为两种11,第一种是针对一般负荷进行潜力分析,从而评估某个区域的需求响应潜力;第二种是对某个具体负荷进行潜力分析,比如空调、典型建筑等,来得到该类型负荷的精确削减潜力。第一种中最常用的是使用用户的价格弹性系数,通过估算电价的变化来评估用户的削减潜力,这种方法的优点是所有用户都可以使用价格弹性来描述,在潜力评估中可以将区域中所有用户考虑进去,缺点则是价格弹性系数无法得到精确值。第二种中常用方法是对具体的负荷进行详细建模,然后根据实际参数求解得到该负荷的需求响应潜力,这种方法优点是能精确估算特定负荷的需求响应潜力,缺点则是无法用于评估某个较大区域范围总的需求响应潜力。

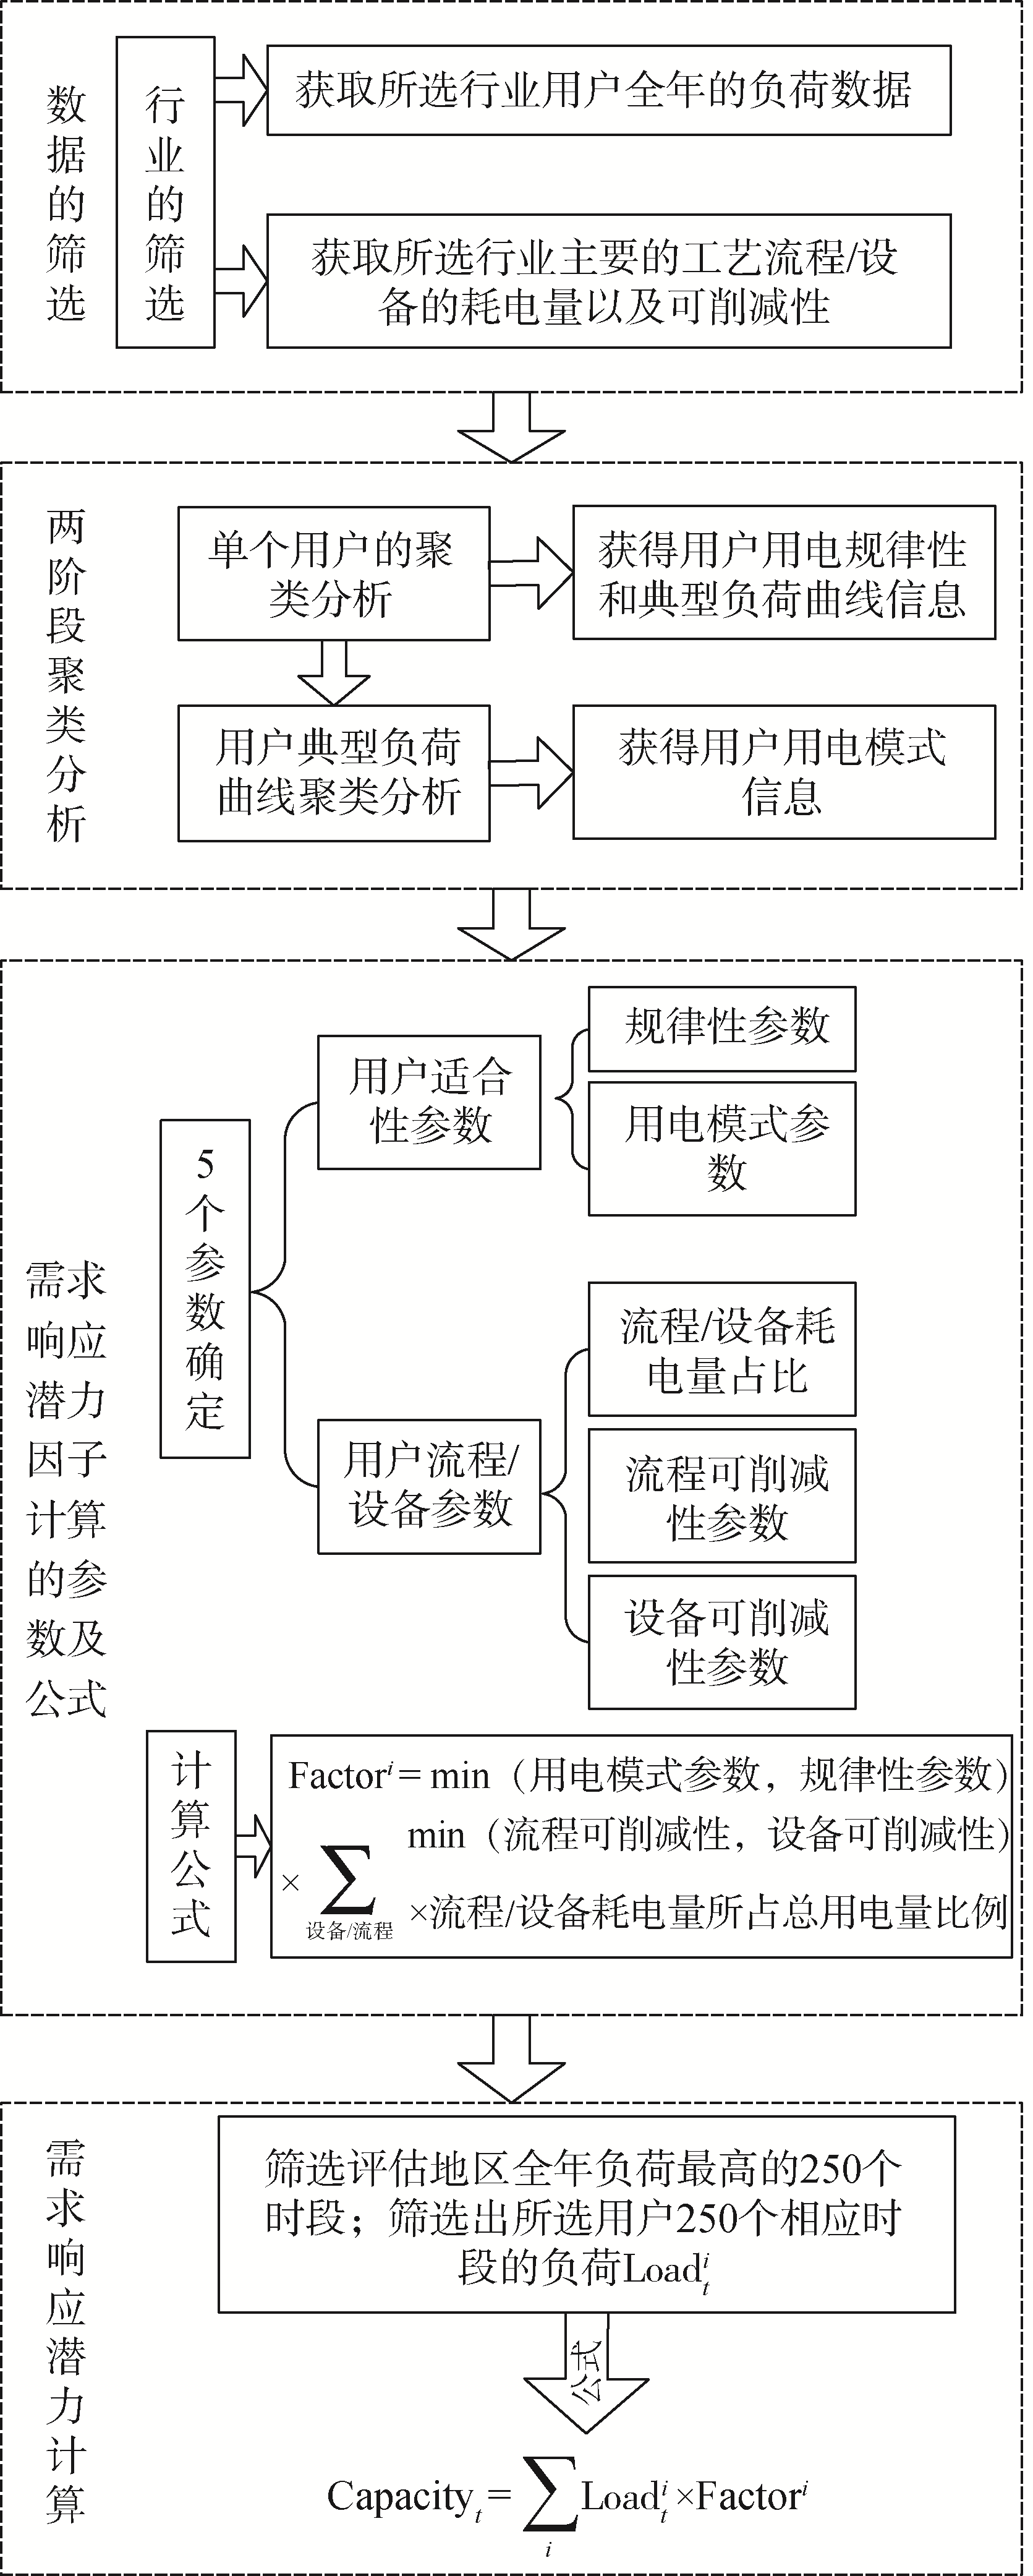
    为了解决目前没有能够较好的评估某个区域的需求响应潜力方法,本文提出了一种基于两阶段聚类分析需求响应潜力评估方法用于评估某个区域的需求响应潜力:因为需求响应是以用户为基本单位的,所以该方法使用两阶段聚类,分析用户的用电模式与用电规律性,然后将用户的两个用电特性与用户的行业负荷特性相结合来评估用户的需求响应潜力因子,最后使用区域内全部用户的需求响应潜力因子与用户的负荷得到该区域的需求响应潜力。本文使用广东某市(以下称D市)386个用户负荷数据,评估了D市需求响应潜力得到了相对合理的结果,表明这个方法有一定使用价值。

  • 需求响应潜力分析框架如图1所示。

    Figure 1.  Improved ant colony clustering algorithm calculation

  • 很多行业由于行业的特性不适合参与需求响应,我们可以通过度电产值和耗电量两个标准筛选出可能适合参与需求响应的行业。度电产值表示每度电能给企业带来的收益12。需求响应用户只有负荷大时才有削减空间,因此耗电量大的行业一般来说拥有更高的需求响应潜力。

  • 由于需求响应的参与是以用户为基本单位的13,因此两阶段聚类分析的目的是分析用户是否适合参与需求响应。本文主要是使用了规律性和用电模式类型两个指标来评估用户的适合性。

  • 第一阶段对单一用户的全年日负荷曲线进行聚类分析,得到用户的典型负荷曲线和用户用电规律性,其中用户用电规律性用聚类上限表示。附图A1展示了聚类上限Kmax=4和Kmax=8的聚类结果。由附图A1可知Kmax=4的用户全年基本只有一种主要用电习惯,Kmax=8的用户则有3~4种主要用电习惯,可以得知聚类上限越低的用户用电规律性越强。

    计算步骤为:

    1)选取用户一年365条日负荷曲线。每条日负荷曲线每15分钟一个点,总共96个点组成。

    2)使用k均值算法14对用户一年365条日负荷曲线进行聚类,从K=2开始不断增加聚类的数量K,直到将一条曲线聚为一类时停止聚类,此时的聚类数量K-1为用户的聚类上限Kmax

    3)计算每个聚类数量K下聚类质量评估指标-轮廓指数(scatter index,SI)15,计算方法如式(1)所示,式中pn表示第n条日负荷曲线的向量;p¯表示全部日负荷曲线的均值;ck表示第k个聚类中心向量;d表示两个向量的欧式距离。SI最小的为用户的最佳聚类数量Kopt,最佳聚类数量Kopt下日负荷曲线最多的聚类中心为用户的典型负荷曲线Ltpy

    SI=n=1Nd2pn,p¯k=1Kd2ck,p¯p¯=1Nn=1Npn ((1))
  • 第二阶段对第一阶段得到的用户典型负荷曲线进行聚类分析,得到用户的用电模式(迎峰型、高负荷率型、避峰型)。其计算步骤为:

    1)选取所有I个用户的I条典型日负荷曲线。每条日负荷曲线每15 min一个点,总共96个点组成。

    2)由于聚类是将每天的高峰负荷所在时段相同的用户归为一类,如果选取日负荷96点曲线作为特征向量的话会存在很多冗余信息,不利于聚类的准确性。因此本文使用特征提取的方法对用户聚类。总共选取了5个特征5,日负荷曲线的负荷率、日峰谷差率、峰期负荷率、平期负荷率、谷期负荷率,其定义与物理意义如表1所示。

    时段指标定义物理意义
    全天0:00-24:00负荷率Pav/Pmax反映负荷全天变化
    日峰谷差率(Pmax-Pmin)/Pmax反映负荷全天最大最小负荷的差距
    峰期14:00-17:0019:00-22:00峰期负荷率Pav.peak/Pmax反映峰期负荷使用量
    谷期0:00-8:00谷期负荷率Pav.valley/Pmax反映谷期负荷使用量
    平期8:00-14:0017:00-19:0022:00-24:00平期负荷率Pav.flat/Pmax反映平期负荷使用量

    Table 1.  Definition and physical meaning of 5 characteristics

    3)以用户的5个特征值为特征向量使用k均值算法进行聚类,将聚类数量K设定为3类,从而得到每个用户所属的用电模式。

  • 需求响应潜力因子是一个在0~1之间用来表示用户需求响应潜力大小的值。0表示用户完全没有需求响应潜力,1表示用户的全都负荷可以参与需求响应。需求响应潜力因子的计算主要是两个方面的参数:用户的适合性参数,用户的流程/设备参数。

    确定参数后使用式(2)来计算用户的需求响应潜力因子:

    Factori=min(,)×/min(,)×/ ((2))

    式中:Factori为用户i的需求响应潜力因子。

  • 通常来说只有在系统负荷高的时候才会需要需求响应,因此只需要评估系统高负荷时段的需求响应潜力。首先筛选出系统全年负荷最高的250个时段,然后提取各个用户对应时段的负荷。最后使用式(3)计算出系统各个时段的需求响应潜力。

    Capacityt=iLoadti×Factori,t=1,2,,250 ((3))

    式中:Capacityt表示第t个时段的需求响应潜力总量;Loadti表示第i个用户第t个时段的负荷;Factori表示第i个用户的需求响应潜力因子。

  • 本节使用上述的需求响应潜力评估框架估算广东省D市的需求响应潜力。
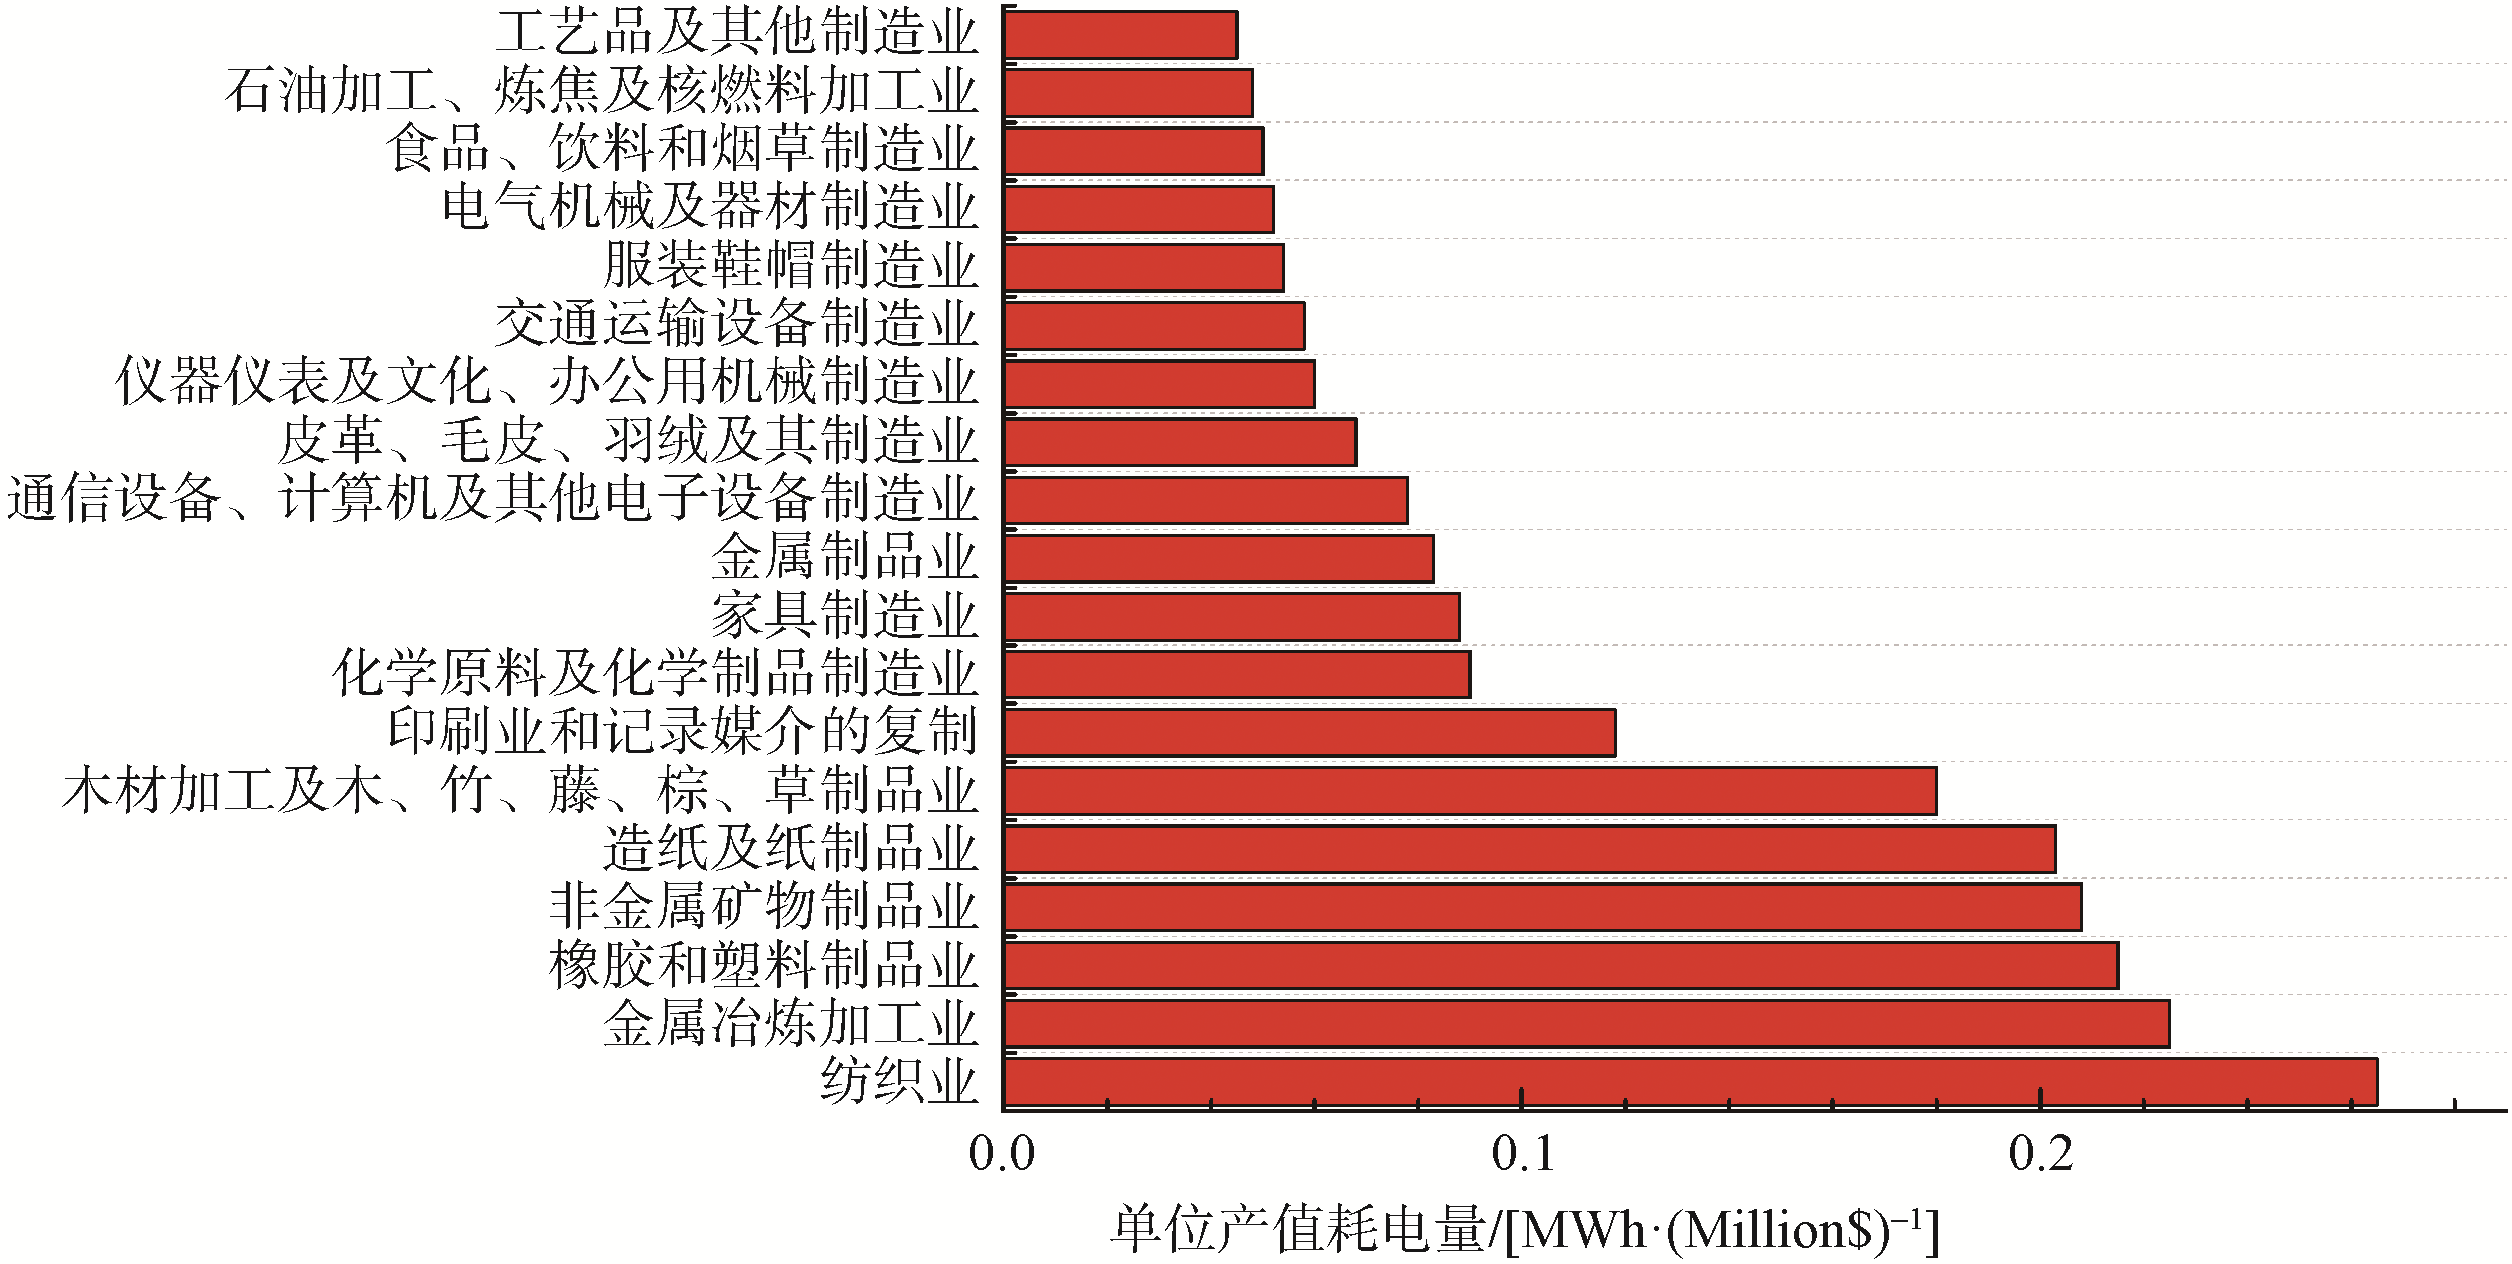
  • 通过美国研究报告12得到工业中主要的19个行业16的单位产值耗电量(度电产值的倒数)如图2所示。单位产值耗电量越高,度电产值越低,用户参与需求响应的收益越高。

    Figure 2.  Power consumption per unit of output in typical industries

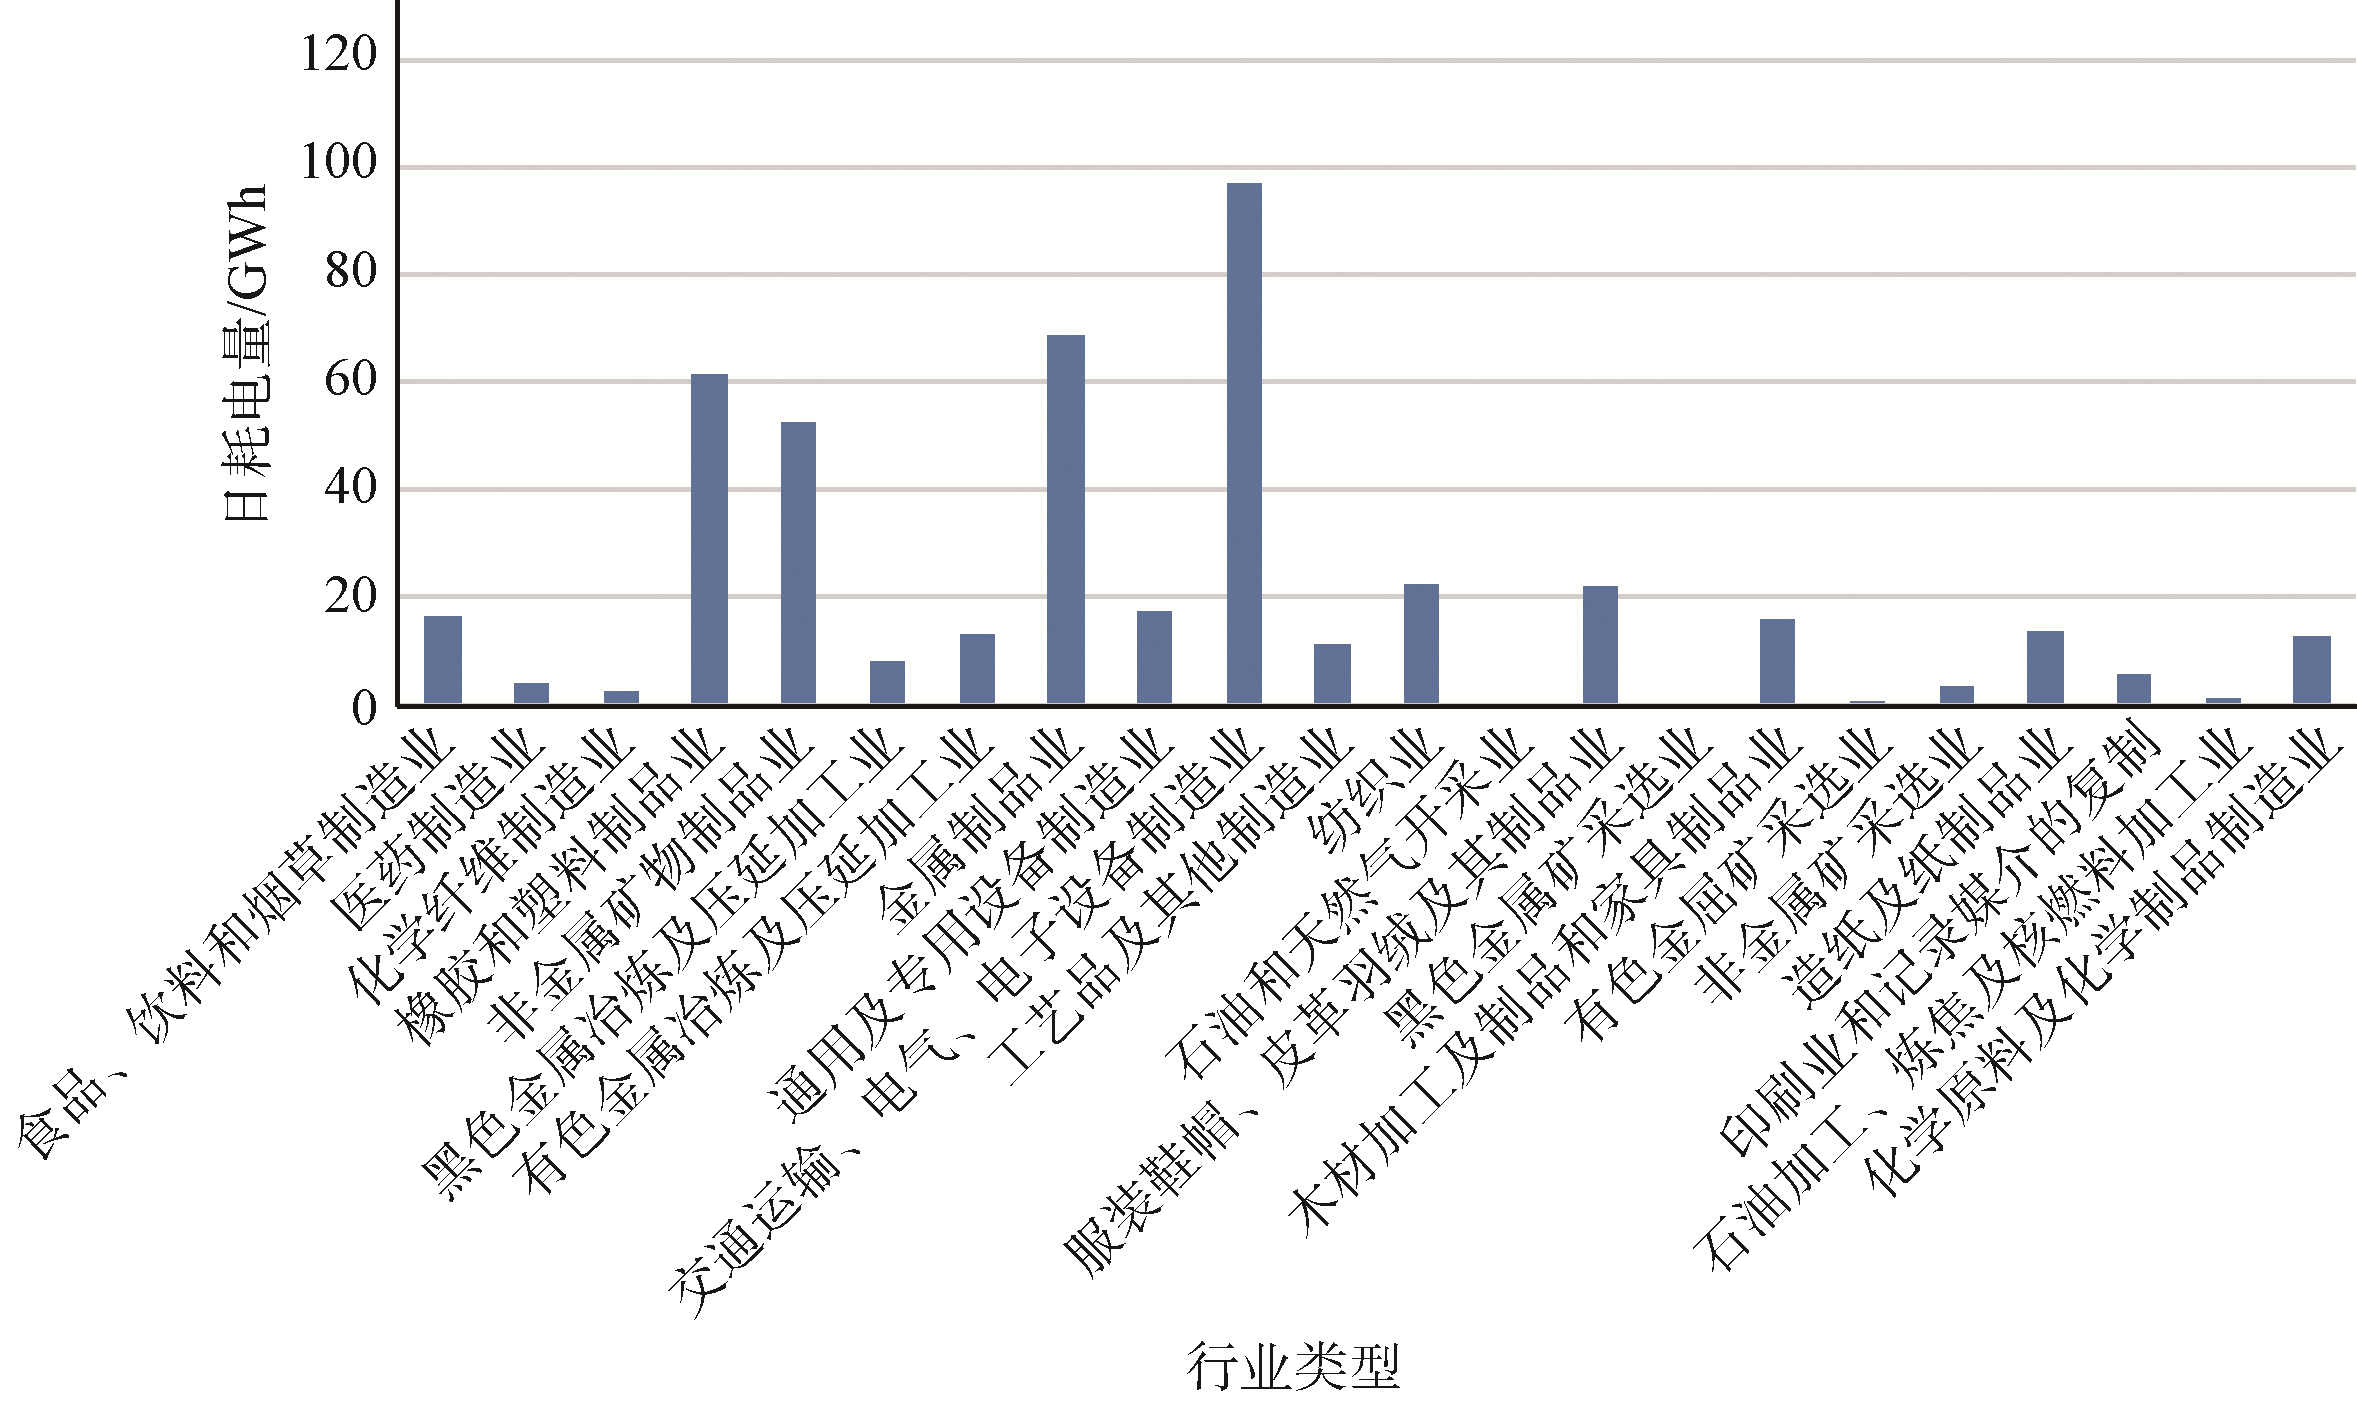
    图3为选取的广东省典型日2017年6月27日的

    Figure 3.  Total electricity consumption for typical days in typical industries of G province

    各行业的总耗电量图,用电量前4的为交通运输、电气、电子设备制造业,金属制品业,橡胶和塑料制品业。通过以上两个标准,本文首先挑选出22个用电量高的工业,然后在22个工业中筛选出度电产值低的工业13个。商业行业分类较少,本文考虑住宿和餐饮业、批发和零售业两个商业行业。

    由上所述最终选取了15个可作为需求响应资源的行业,其中包括13个工业行业2个商业行业。

    挑选了D市15个行业中用电量高的386个用户,用户信息如附表A1所示。

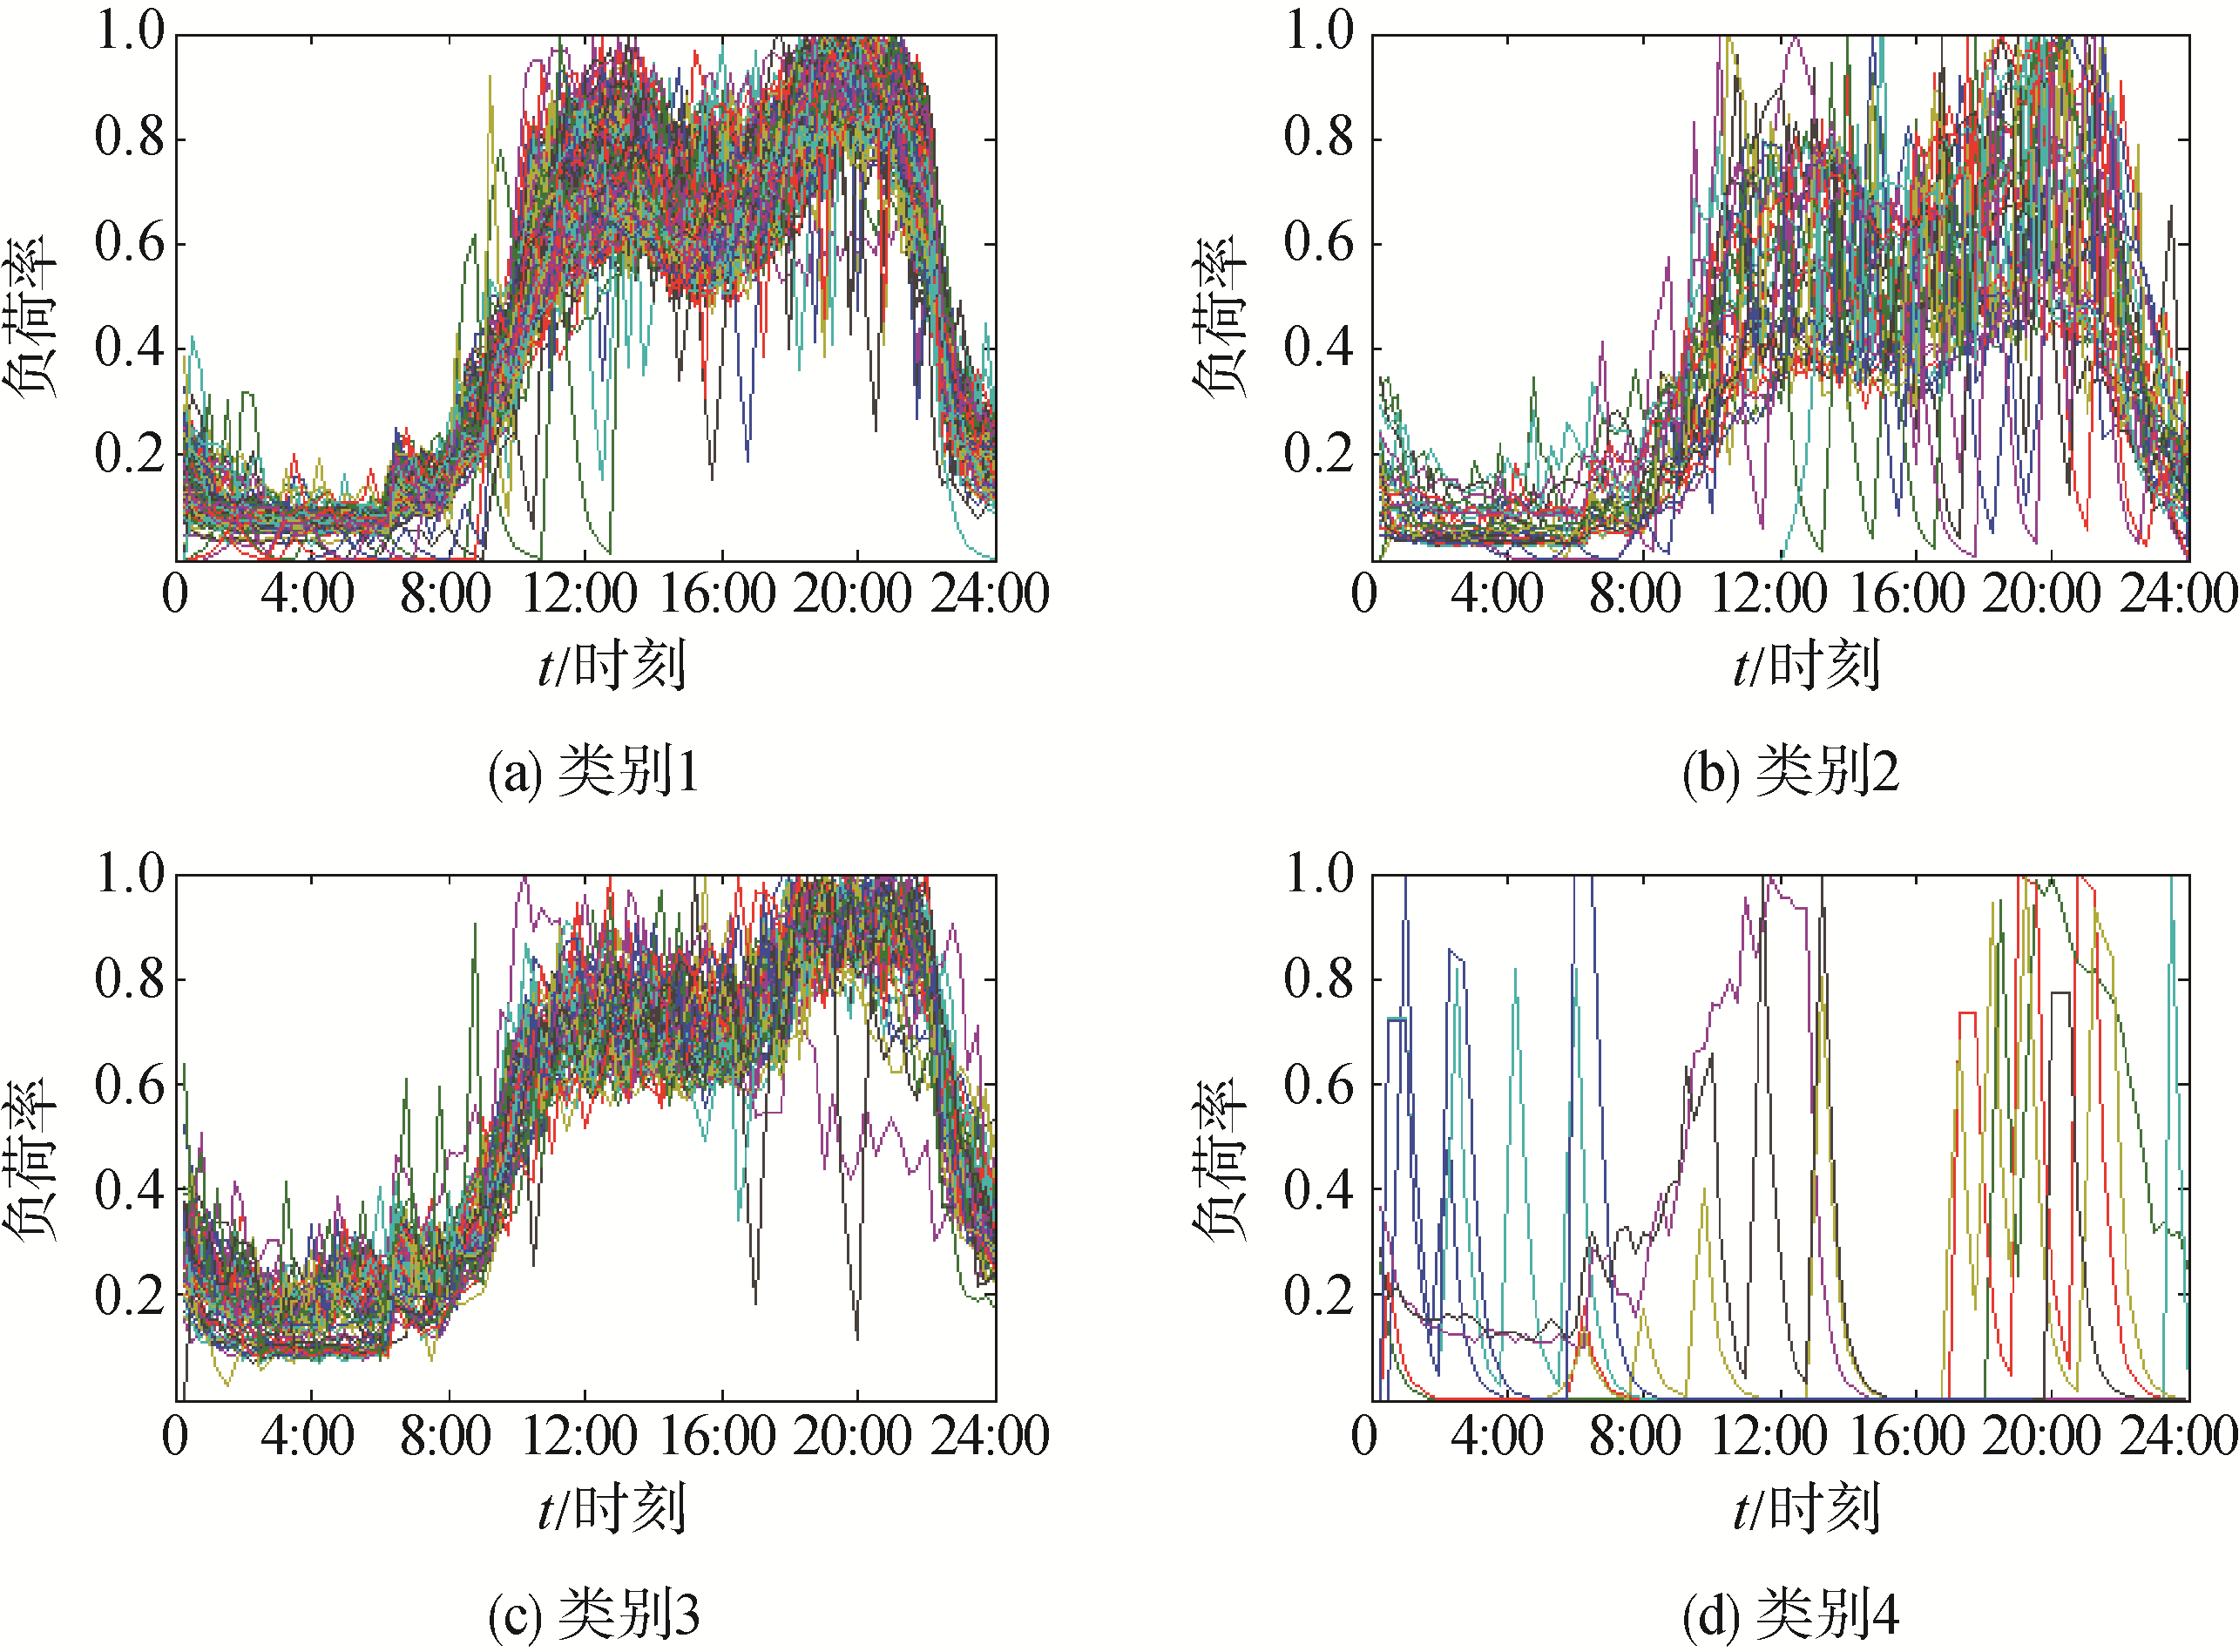
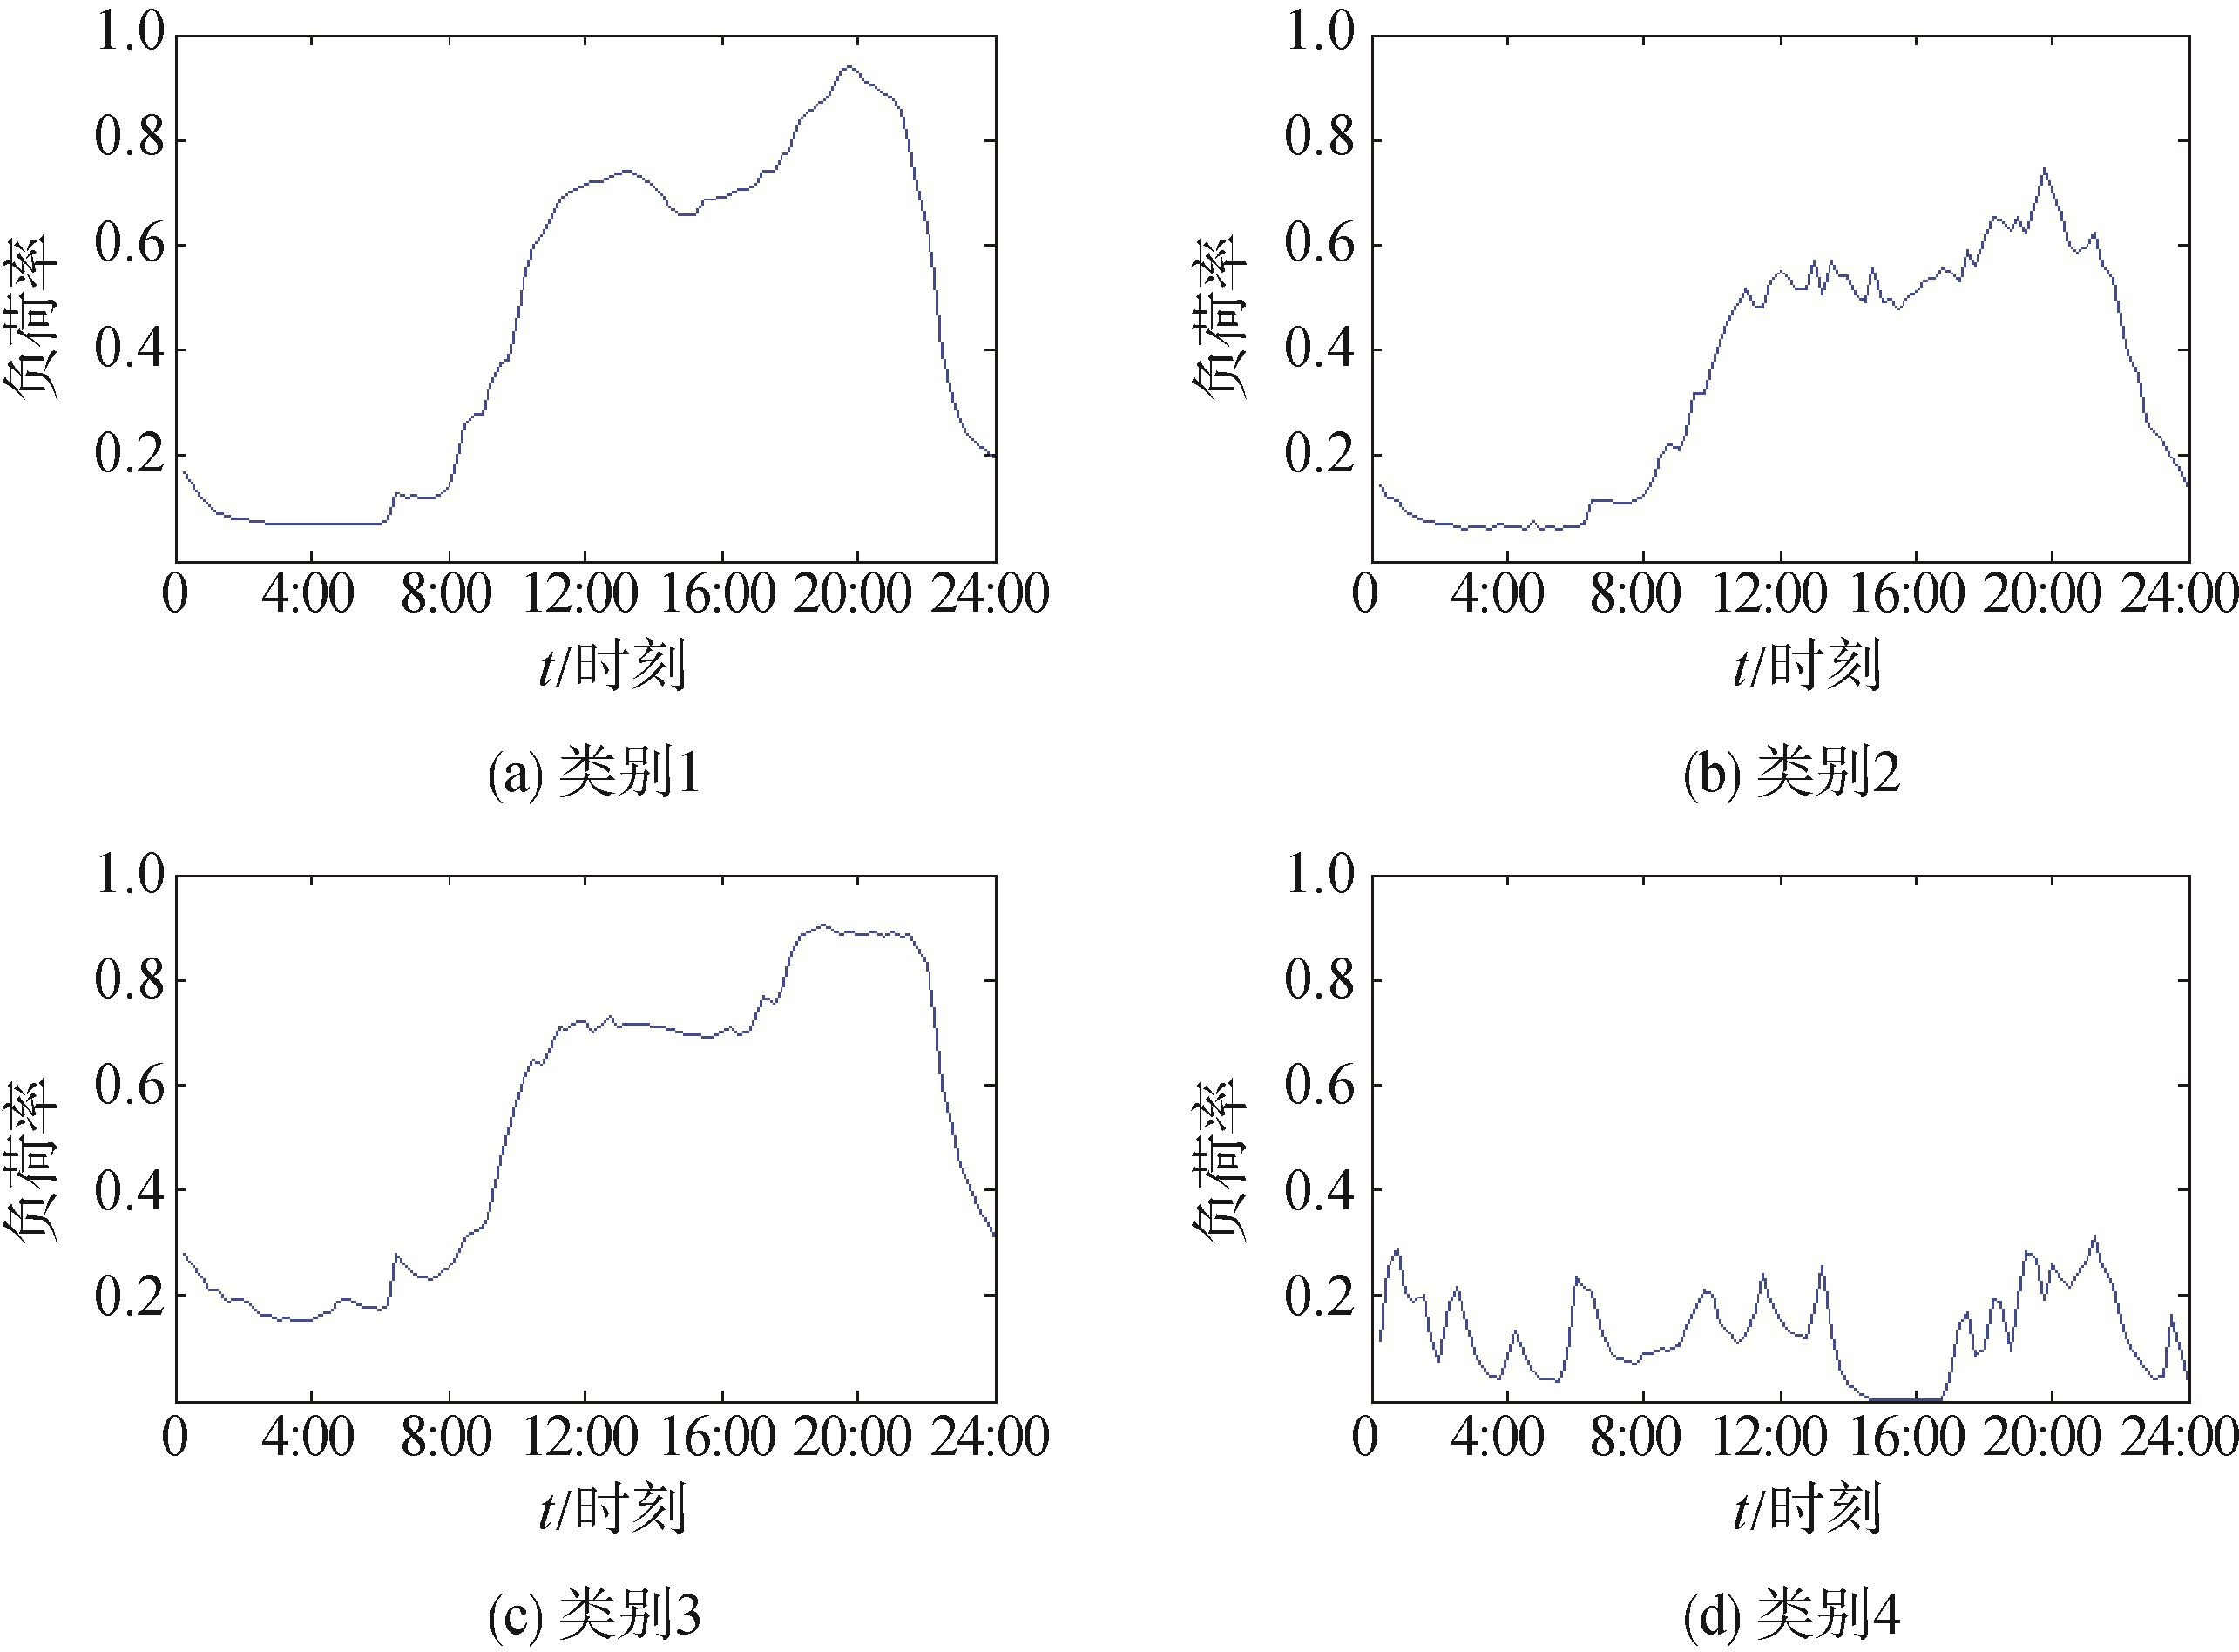
  • 以某批发与零售业用户为例,使用K均值算法从K=2开始不断增加其聚类数量K,当K=5时会出现将一条曲线聚到一类的情况,则此用户聚类上限Kmax=4。其聚类结果如图4所示。4个类别的聚类中心如图5所示。

    Figure 4.  Clustering results for a wholesale and retail user with K=4

    Figure 5.  Clustering center for a wholesale and retail user with K=4

    表2给出了该用户不同聚类数量下聚类结果的SI值。由表2可知该用户的最佳聚类数量为4。聚类数量为4时,其各个类别所包含的日负荷曲线数量如表3所示。图5中第1条负荷曲线为该用户典型负荷曲线。

    聚类数量K234
    SI0.762 80.861 70.601 3

    Table 2.  SI value under different number of clusters

    类别1234
    日负荷曲线数量22933798

    Table 3.  Number of load curves of different categories under the optimal number of clusters

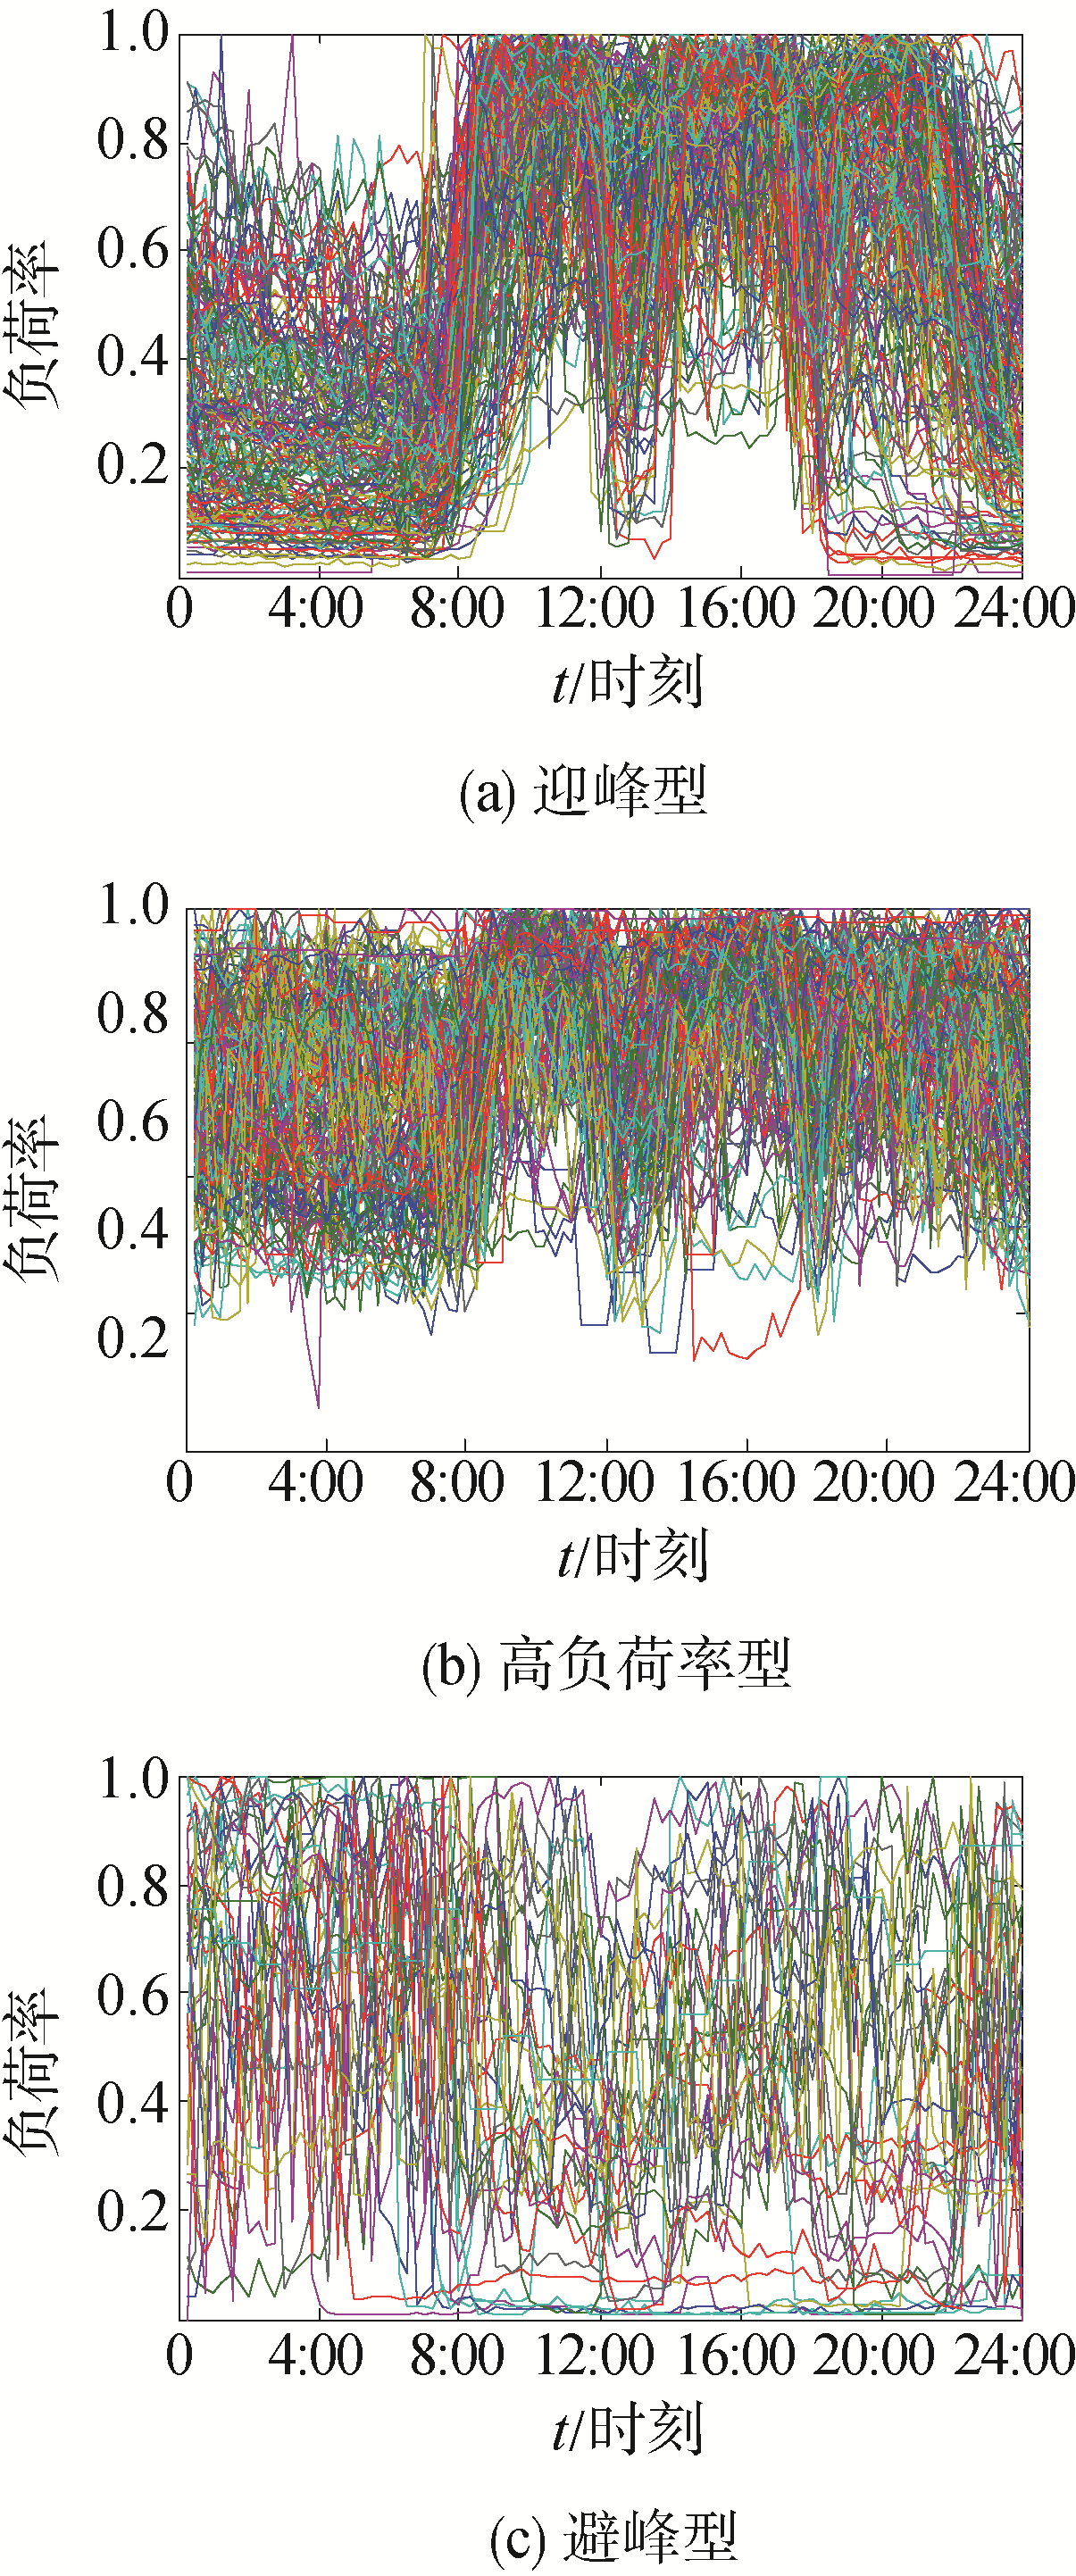
  • 上一步中,对386个用户的分别聚类分析完之后,可以得到386条典型负荷曲线。使用k均值算法对这386条典型负荷曲线进行聚类分析。令聚类数量K=3,得到的聚类结果如图6所示。其中在第1类用户为迎峰型用户,在第2类用户为高负荷率型用户,第3类中包含避峰型和少部分不属于上述三类的用户。

    Figure 6.  Clustering results of user typical load curve in D city

  • 需求响应潜力因子的适合性参数根据2.2节中对用户的分析来确定。由2.2节中的分析可知,用电模式中需求响应潜力由高到低分为迎峰型、高负荷率型、避峰型,用电规律性越高的需求响应潜力越高。由以上结论可以确定用户的适合性参数如表4所示。

    适合性类别适合性参数
    用电模式迎峰型1
    高负荷率型0.5
    避峰型0
    用电规律性聚类上限2~151
    聚类上限16~200.8
    聚类上限20~250.5
    聚类上限25~300.2

    Table 4.  Parameters of user power usage pattern and power regularity

    通过调研报告可以得到工业负荷参数12,如附表A2所示。商业参数17-18如附表A3所示。

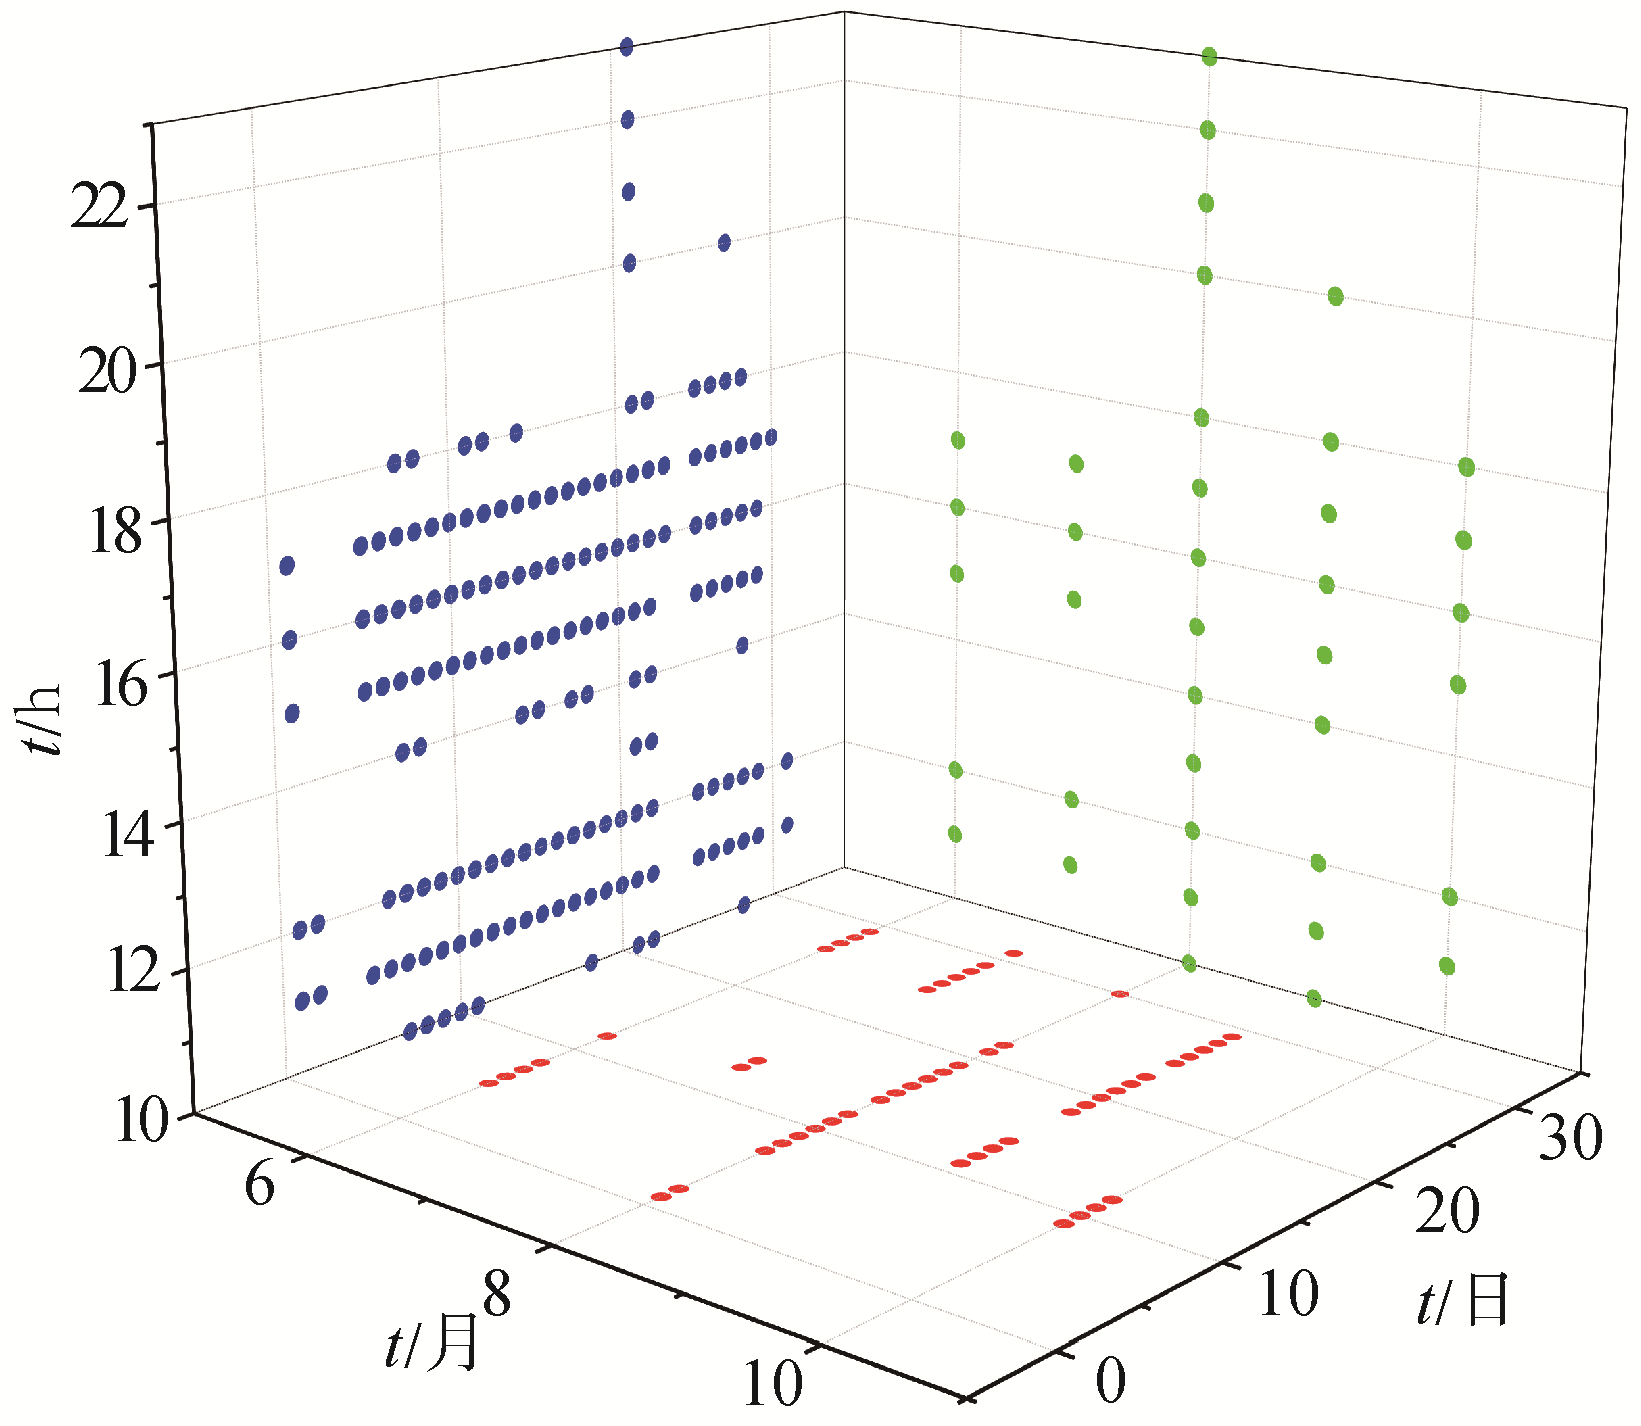
  • 本文使用广东省电网2017年全年的负荷数据,筛选出负荷最高的250个时段,其三维投影图如图7所示。

    Figure 7.  Selected 250 hours projection maps

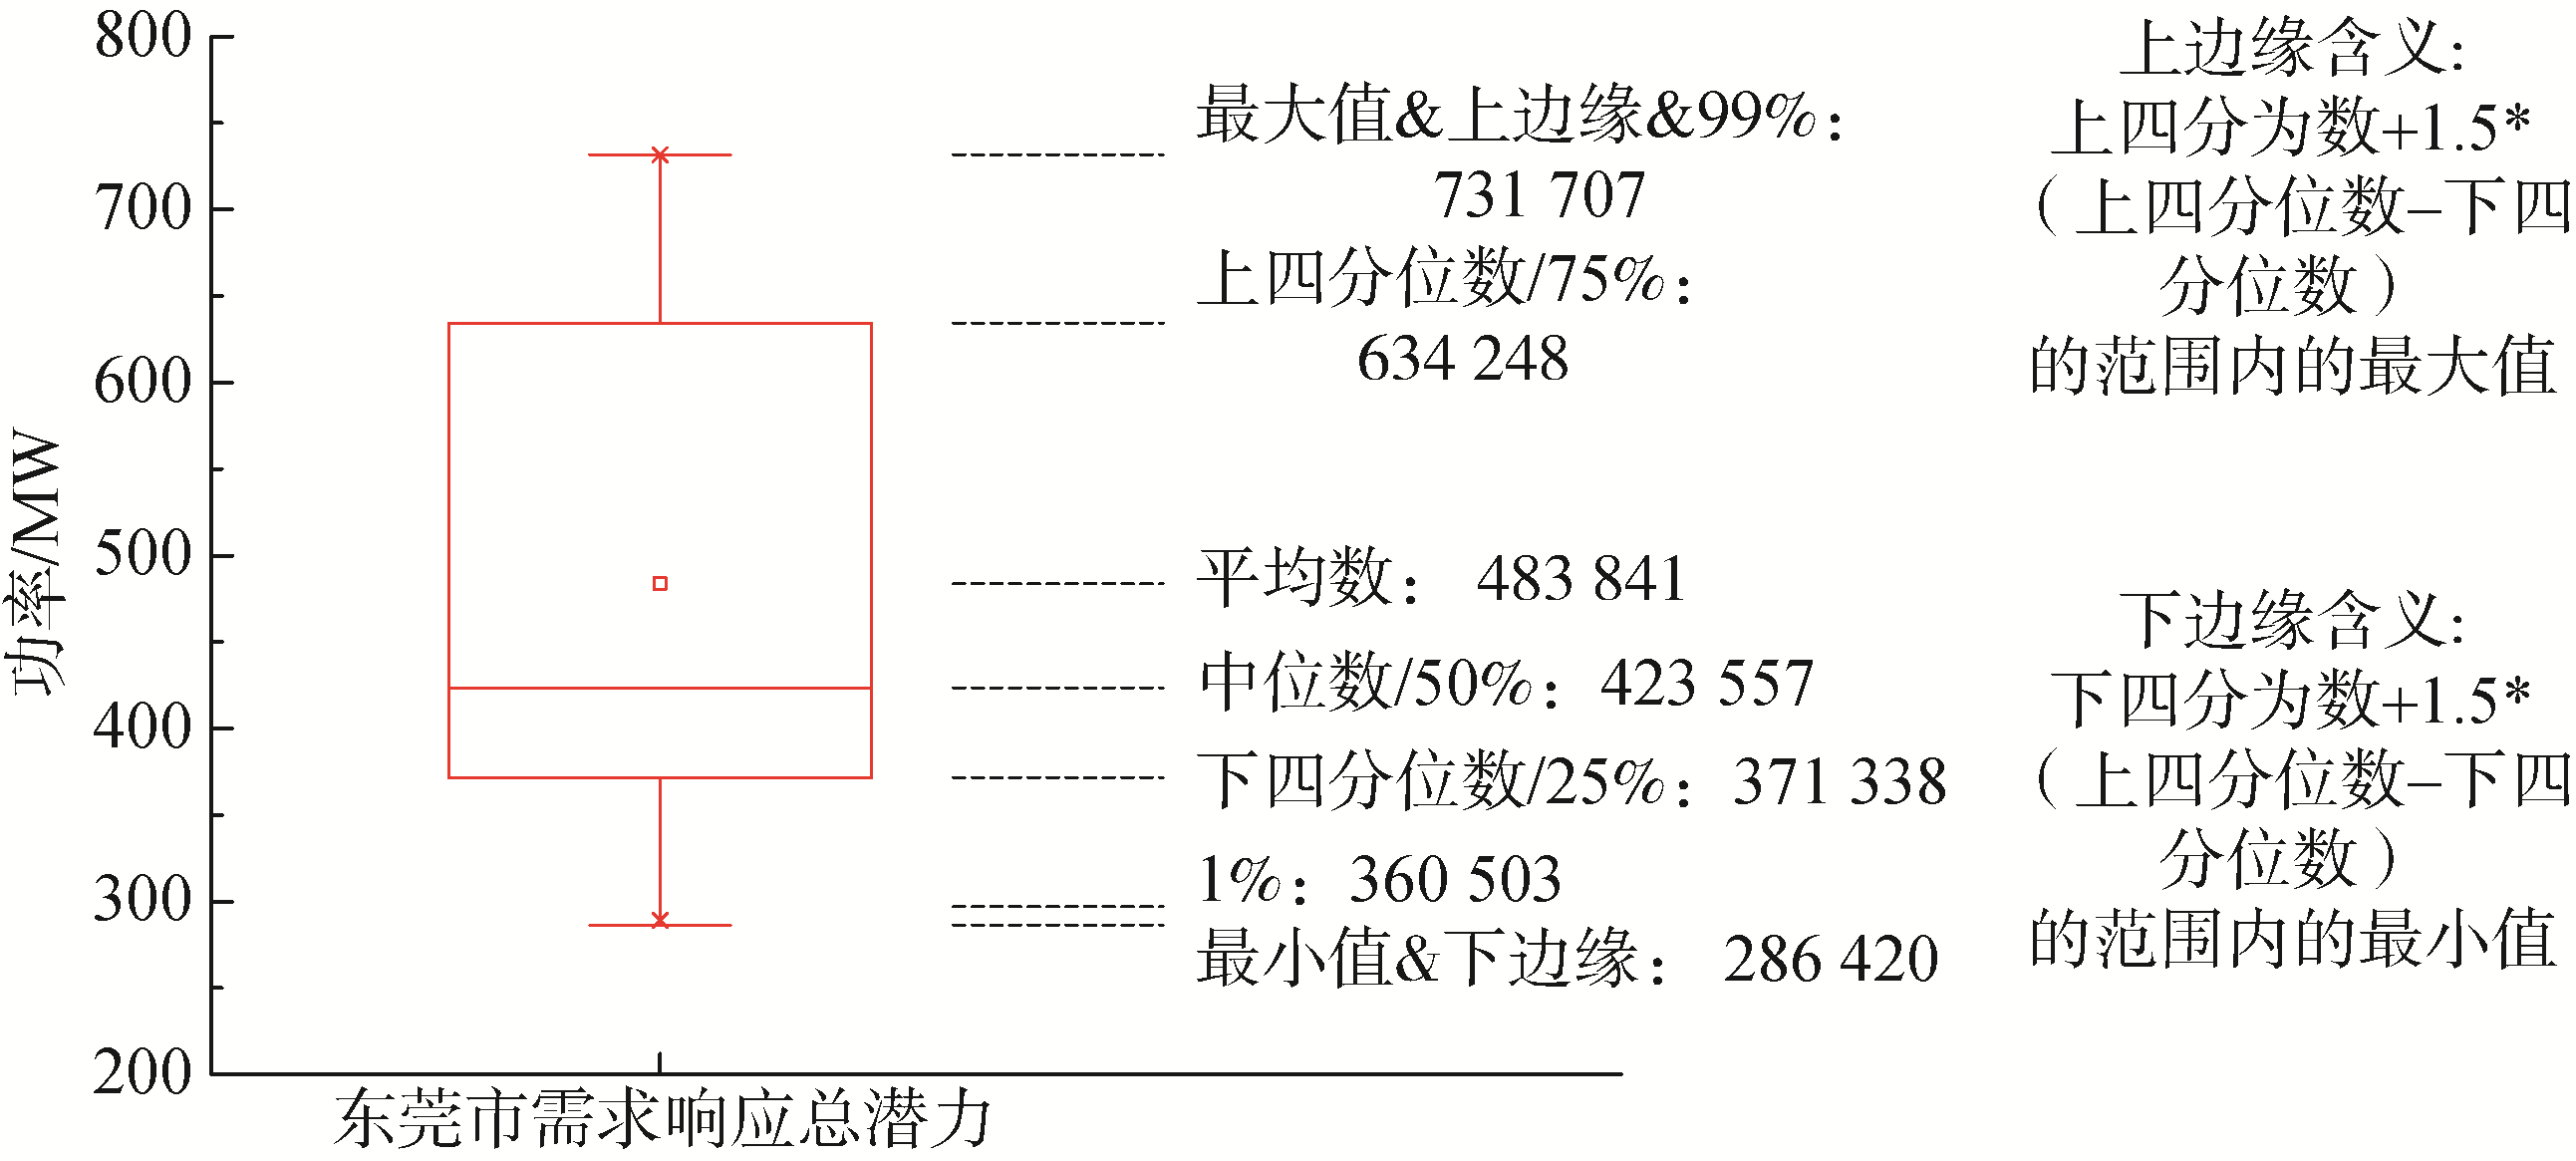
    为了评估D市需求响应的总潜力,本文使用386个用户中各行业用户的需求响应潜力因子的均值代表相应行业的需求响应潜力因子。然后使用D市各行业250个时段中各时段的负荷乘以相应行业需求响应潜力因子求和得到D市250个时段中各时段的需求响应潜力如图8所示。由图8可以看出D市250 h需求响应均值约484 MW,D市最大负荷约为15 GW,D市需求响应潜力约为D市最大负荷的3.2%。

    Figure 8.  The total potential of demand response in Dongguan for 250 hours

    由美国2018需求响应与高级计量装置评估报告19可知美国各市场需求响应参与情况如表5所示。美国各市场需求响应量最大负荷占比在2.9%~6.5%之间,本文计算D市的结果为3.2%,在区间之内,结果合理,因此本文所提供的需求响应评估框架有一定的实用价值。

    独立系统运营商需求资源/MW占最高负荷的比例/%
    CAISO1 2932.6
    ERCOT3 0094.3
    ISO-NE6842.9
    NYISO1 3534.6
    PJM9 5206.5
    共计27 5415.6

    Table 5.  2017 U.S. market demand response participation ratio

  • 本文针对现阶段一般负荷的需求响应潜力评估中只有使用价格弹性系数的方法,且价格弹性系数的准确数据难以获得的问题20,首次设计了一种基于两阶段聚类分析的需求响应潜力评估方法。该方法使用一些通用,且易于获取的数据,来评估用户的用电模式和用电规律性,计算每个用户的潜力因子。因此,其能适用于任何区域的需求响应潜力评估,有较强的泛用性。最后使用该方法评估D市需求响应潜力的案例,也证明了其有较高的实用价值。本次研究中出现了各种数据的选取,后续研究可以针对数据选取标准的不同做定量分析。

Reference (20)

Catalog

    /

    DownLoad:  Full-Size Img  PowerPoint
    Return
    Return