• Peer Review
  • Non-profit
  • Global Open Access
  • Green Channel for Rising Stars
Volume 9 Issue 1
Mar.  2022
Turn off MathJax
Article Contents

LIU Xinhua.Research on Underwater Topography Monitoring of Offshore Wind Turbine Foundation Based on Multi-Beam Data[J].Southern Energy Construction,2022,09(01):64-70. doi:  10.16516/j.gedi.issn2095-8676.2022.01.010
Citation: LIU Xinhua.Research on Underwater Topography Monitoring of Offshore Wind Turbine Foundation Based on Multi-Beam Data[J].Southern Energy Construction,2022,09(01):64-70. doi:  10.16516/j.gedi.issn2095-8676.2022.01.010

Research on Underwater Topography Monitoring of Offshore Wind Turbine Foundation Based on Multi-Beam Data

doi: 10.16516/j.gedi.issn2095-8676.2022.01.010
  • Received Date: 2021-03-29
  • Rev Recd Date: 2021-05-07
  • Publish Date: 2022-03-25
  •   Introduction  In order to ensure the safety of operation of offshore wind turbine, it is necessary to grasp the change of topography around the offshore wind turbine foundation.  Method  The multi-beam sounding system was used to monitor the terrain around the wind turbine for 6 times, and the high-precision and high-density underwater terrain point cloud data were obtained. Through the data processing and analysis of the point cloud data, the high-precision underwater terrain digital elevation model (DEM) was constructed. Through the superposition analysis of the DEM, the quantity of erosion in different periods was calculated. Finally, the change of terrain in different periods was displayed by 3D model, and the causes of erosion were analyzed.  Result  The most direct reason for the terrain change around the wind turbine is that when a strong typhoon passes through the sea area of the wind farm, the seabed and the local area of the wind turbine usually undergo a large overall change; The combined action of tidal current and waves is another important cause of local erosion and siltation of the seabed topography in this area.  Conclusion  The multi-beam sounding system is effective in monitoring the underwater topography, which can provide important data support for the safe operation and maintenance of offshore wind power. The practice of the project has a good reference significance for carrying out underwater topography monitoring of similar projects.
  • [1] 裴爱国, 何登富. 海上风电大数据发展研究 [J]. 南方能源建设, 2018, 5(2): 19-23. DOI:  10.16516/j.gedi.issn2095-8676.2018.02.003.

    PEIA G, HED F. Research on the development of big data with offshore wind power [J]. Southern Energy Construction, 2018, 5(2): 19-23. DOI:  10.16516/j.gedi.issn2095-8676.2018.02.003.
    [2] 郑钊颖, 冯奕敏. 广东海上风电产业发展路径与对策研究 [J]. 南方能源建设, 2020, 7(4): 18-25. DOI:  10.16516/j.gedi.issn2095-8676.2020.04.003.

    ZHENGZ Y, FENGY M. Research on the development approach and policy recommendations of Guangdong offshore wind power industry [J]. Southern Energy Construction, 2020, 7(4): 18-25. DOI:  10.16516/j.gedi.issn2095-8676.2020.04.003.
    [3] 张同伟, 秦升杰, 唐嘉陵, 等. 深水多波束测深系统现状及展望 [J]. 测绘通报, 2018(5): 82-85. DOI:  10.13474/j.cnki.11-2246.2018.0148.

    ZHANGT W, QINS J, TANGJ L, et al. Technical status development trend of deep-sedmuti-team bathmetry system [J]. Bulletin of Surveying and Mapping, 2018(5): 82-85. DOI:  10.13474/j.cnki.11-2246.2018.0148.
    [4] 饶光勇, 陈俊彪. 多波速测深系统和侧扫声呐系统在堤围险段水下地形变化监测中的应用 [J]. 广东水利水电, 2014(6): 69-72. DOI:  10.3969/j.issn.1008-0112.2014.06.018.

    RAOG Y, CHENJ B. Application of multi-beam bathymetry system and side scan sonar system to the monitor of underwater terrain changes in dangerous section of embankment [J]. Guangdong Water Resources and Hydropower, 2014(6): 69-72. DOI:  10.3969/j.issn.1008-0112.2014.06.018.
    [5] 刘权. RESON Seabat T50-P多波束系统在水下基坑测量中的应用 [J]. 水科学与工程技术, 2020(3): 88-91. DOI:  10.19733/j.cnki.1672-9900.2020.03.23.

    LIUQ. Application of reson seabat T50-P multi-beam system in underwater foundation pit survey [J]. Water Science and Engineering Technology, 2020(3): 88-91. DOI:  10.19733/j.cnki.1672-9900.2020.03.23.
    [6] 王鑫, 潘华志, 罗胜, 等. 机载激光雷达测深技术研究与进展[J]. 海洋测绘, 2019, 39(5): 78-82. DOI:  10.3969/j.issn.1671-3044.2019.05.019.

    WANGX, PANH Z, LUOS, et al. Bathymetric technology and research status of airborne lidar [J]. Marine Surveying and Mapping, 2019, 39(5): 78-82. DOI:  10.3969/j.issn.1671-3044.2019.05.019.
    [7] 何亮, 马琨, 李端有. 多波束联合水下机器人在大坝水下检查中的应用 [J]. 大坝与安全, 2019(5): 46-51. DOI:  10.3969/j.issn.1671-1092.2019.05.013.

    HEL, MAK, LID Y. Application of multi-beam combined unmanned underwater vehicles in dam underwater inspection [J]. Dam & Safety, 2019(5):46-51. DOI:  10.3969/j.issn.1671-1092.2019.05.013.
    [8] 邓卫红, 刘凡. 多波束系统在500 kV福港线海底电缆路由地形变化分析中的应用[J]. 南方能源建设, 2019, 6(增刊1): 119-123. DOI:  10.16516/j.gedi.issn2095-8676.2019.S1.023.

    DENGW H, LIUF. Application of multi beam system in the analysis of the terrain change of the 500 kV Fugang high-voltage submarine cable [J]. Southern Energy Construction, 2019, 6(Supp.1): 119-123. DOI:  10.16516/j.gedi.issn2095-8676.2019.S1.023.
    [9] 王楠, 徐永臣, 陶常飞. 多波束海底地形三维虚拟仿真研究 [J]. 海岸工程, 2019, 38(3): 203-209. DOI:  10.3969/j.issn.1002-3682.2019.03.005.

    WANGN, XUY C, TAOC F. Research on 3D visualization of multi-beam seabed terrain [J]. Coastal Engineering, 2019, 38(3): 203-209. DOI:  10.3969/j.issn.1002-3682.2019.03.005.
    [10] 黄志文, 陈亮, 葛小博. 基于DEM技术的水下泥沙冲淤分析 [J]. 黑龙江水专学报, 2008, 35(1): 22-25. DOI:  10.3969/j.issn.2095-008X.2008.01.007.

    HUANGZ W, CHENL, GEX B. Analysis of bank erosion and deposition based on DEM [J]. Journal of Heilongjiang Hydraulic Engineering College, 2008, 35(1): 22-25. DOI:  10.3969/j.issn.2095-008X.2008.01.007.
    [11] 冯艺, 孙红亮. 三维多波束系统在库区冲刷淤积计算分析中的应用 [J]. 物探化探计算技术, 2020, 42(1): 104-110. DOI:  10.3969/j.issn.1001-1749.2020.01.14.

    FENGY, SUNH L. Application of 3D multi-beam sonar system in calculation and analysis of scouring and siltation in reservoir area [J]. Computing Techniques for Geophysical and Geochemical Exploration, 2020, 42(1): 104-110. DOI:  10.3969/j.issn.1001-1749.2020.01.14.
    [12] 张红武. 泥沙起动流速的统一公式 [J]. 水利学报, 2012, 43(12): 1387-1396. DOI:  10.13243/j.cnki.slxb.2012.12.002.

    ZHANGH W. A unified formula for incipient velocity of sediment [J]. Journal of Hydraulic Engineering, 2012, 43(12): 1387-1396. DOI:  10.13243/j.cnki.slxb.2012.12.002.
    [13] 左书华, 张娜, 黄玉新, 等. 广东湛江外罗海域水沙环境乃岸滩演变 [J]. 海洋地质前沿, 2016, 32(7): 44-50. DOI:  10.16028/j.1009-2722.2016.07006.

    ZUOS H, ZHANGN, HUANGY X, et al. Water and sediments budget and beach evolvement of the area near Wailuo of Zhanjiang, Guang dong province [J].Marine Geology Frontiers, 2016, 32(7): 44-50. DOI:  10.16028/j.1009-2722.2016.07006.
  • 通讯作者: 陈斌, bchen63@163.com
    • 1. 

      沈阳化工大学材料科学与工程学院 沈阳 110142

    1. 本站搜索
    2. 百度学术搜索
    3. 万方数据库搜索
    4. CNKI搜索

Figures(19)  / Tables(2)

Article Metrics

Article views(258) PDF downloads(56) Cited by()

Related

Research on Underwater Topography Monitoring of Offshore Wind Turbine Foundation Based on Multi-Beam Data

doi: 10.16516/j.gedi.issn2095-8676.2022.01.010

Abstract:   Introduction  In order to ensure the safety of operation of offshore wind turbine, it is necessary to grasp the change of topography around the offshore wind turbine foundation.  Method  The multi-beam sounding system was used to monitor the terrain around the wind turbine for 6 times, and the high-precision and high-density underwater terrain point cloud data were obtained. Through the data processing and analysis of the point cloud data, the high-precision underwater terrain digital elevation model (DEM) was constructed. Through the superposition analysis of the DEM, the quantity of erosion in different periods was calculated. Finally, the change of terrain in different periods was displayed by 3D model, and the causes of erosion were analyzed.  Result  The most direct reason for the terrain change around the wind turbine is that when a strong typhoon passes through the sea area of the wind farm, the seabed and the local area of the wind turbine usually undergo a large overall change; The combined action of tidal current and waves is another important cause of local erosion and siltation of the seabed topography in this area.  Conclusion  The multi-beam sounding system is effective in monitoring the underwater topography, which can provide important data support for the safe operation and maintenance of offshore wind power. The practice of the project has a good reference significance for carrying out underwater topography monitoring of similar projects.

LIU Xinhua.Research on Underwater Topography Monitoring of Offshore Wind Turbine Foundation Based on Multi-Beam Data[J].Southern Energy Construction,2022,09(01):64-70. doi:  10.16516/j.gedi.issn2095-8676.2022.01.010
Citation: LIU Xinhua.Research on Underwater Topography Monitoring of Offshore Wind Turbine Foundation Based on Multi-Beam Data[J].Southern Energy Construction,2022,09(01):64-70. doi:  10.16516/j.gedi.issn2095-8676.2022.01.010
  • 随着国际社会对保障能源安全、保护生态环境、应对气候变化等问题日益重视,加快开发利用可再生能源已成为世界各国的普遍共识和一致行动1。对于广东省而言,在可再生能源中,海上风能资源是最具规模开发潜力的。《广东省海上风电发展规划》2中提出“在2020年实现海上风电力争建设投产12 GW以上”,同时对海上风电场址布局和项目建设进行了规划,“计划建设海上风电场共23个,装机容量66.85 GW”。

    海上风电场所处的自然环境比较恶劣,风机基础在波浪、潮流等作用下会受到一定的冲刷。如何掌握风机基础周边的冲刷程度,保证风机运营安全,已引起各海上风电运维单位的广泛关注。目前最常见的方法是对风机基础周边水下地形进行定期的监测,获取不同时期的地形资料,研究不同时期冲刷量的变化和规律。

    传统的水下地形监测主要采用水下地形测量与固定断面测量相结合的方法。水下地形测量主要采用水面移动平台搭载单波束的方法进行测量,获取不同时期的水下地形数据。虽然单波束在一定程度上解决了水下地形测量问题,但测量效率和精度有较大的局限性,尤其是对微地形的表达方面已无法满足当今的需求。而多波束测深系统具有高精度、高分辨率、全覆盖、高效率等特点,正日益受到广大海洋测量部门和海道测量部门的重视3。国内外许多学者对多波束进行了深入研究,取得了一批显著的成果。饶光勇等4研究了多波束测深系统在堤围险段水下地形变化监测中的应用;刘权等5研究了多波束系统在水下基坑测量中的应用。同时,基于载体的不同,近几年机载和星载测深系统方面也有不少研究。王鑫等6对机载激光LiDAR技术测深进行了研究,该技术主要应用在水深5 m以内的浅水地区,大部分处于实验阶段,实际应用较少。何亮等7采用多波束联合水下机器人对水下地形进监测,虽然作业效率、精度较高,但是操作难度大,成本高,稳定性较差。

    利用多波速测深系统对风机基础进行水下地形监测,目前还少有研究。本文结合工程实例,利用多波束测深系统对广东某海上风电8#风机位周边地形进行定期的水下地形监测,获取了高精度和高密度的水下地形点云数据;通过对点云数据进行数据处理和分析,构建高精度的水下地形数字高程模型DEM;通过数字高程模型叠加分析,计算出不同时期的冲刷量;最后通过三维模型展示不同时期地形的变化,分析引起冲刷的原因,为海上风电安全运行提供了数据支撑。

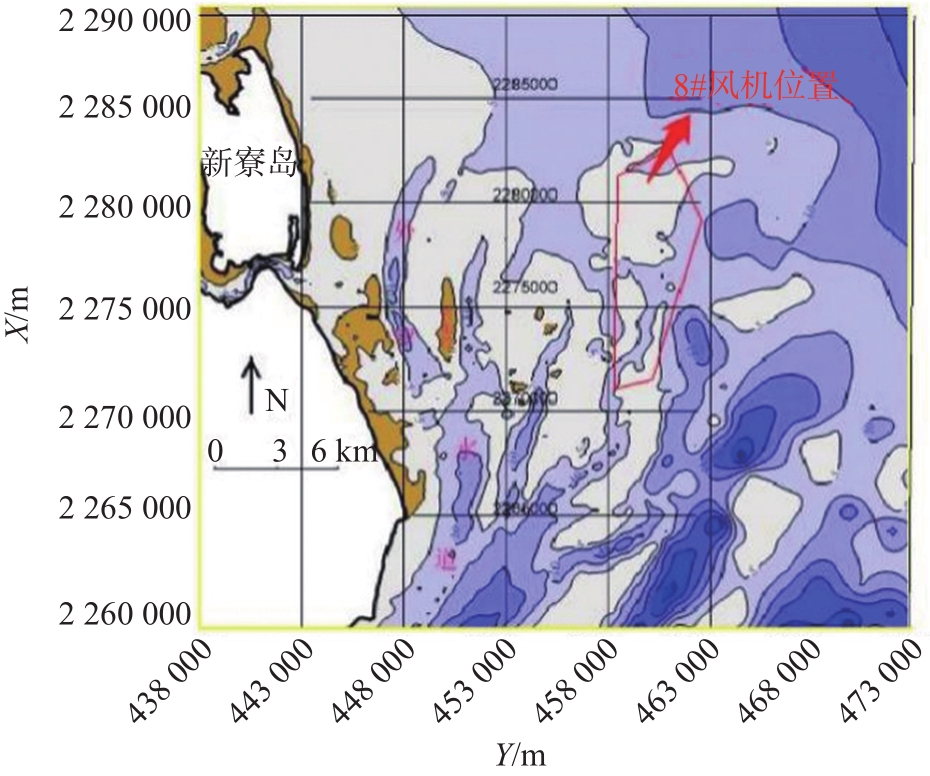
  • 广东某海上风电8#风机位于南海海域,中心概略位置:北纬20.425°,东经110.489°,测量范围风机中心500 m × 500 m,面积约0.3 km2。场址中心离岸距离约15 km,水深4~10 m。所在区域海底地貌属于水下浅滩、水下岸坡地貌单位,有部分沙洲,表层底质以粉砂、细沙为主。

    周边海域的气象条件:平均风速为3.0 m/s;年平均气温为24.5 ℃;海水温度最高值为30.86 ℃,最低海水温度值为28.71 ℃;潮汐为不正规半日混合潮;潮流为不规则全日潮,表现为明显的往复流特征,实测最大流速1.50 m/s。

    为了监测风机周边地形的变化,我们采用多波束测深系统对8#风机周边地形进行了6次测量,监测频率为每6个月监测一次,期间因地形变化较快,监测频率做了适当的调整。

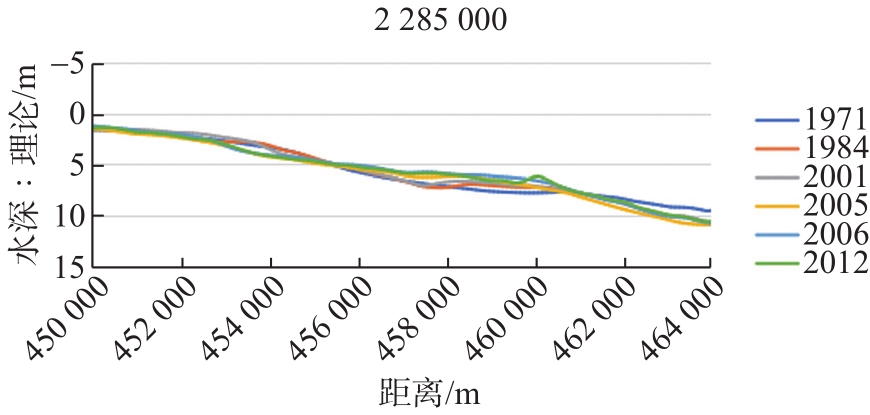
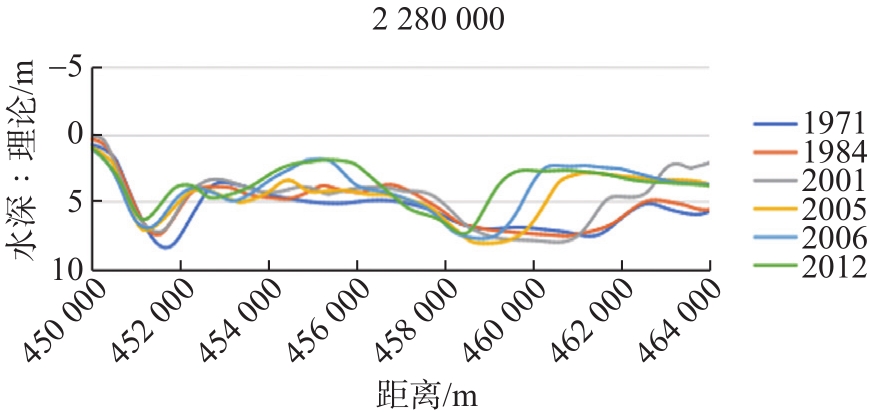
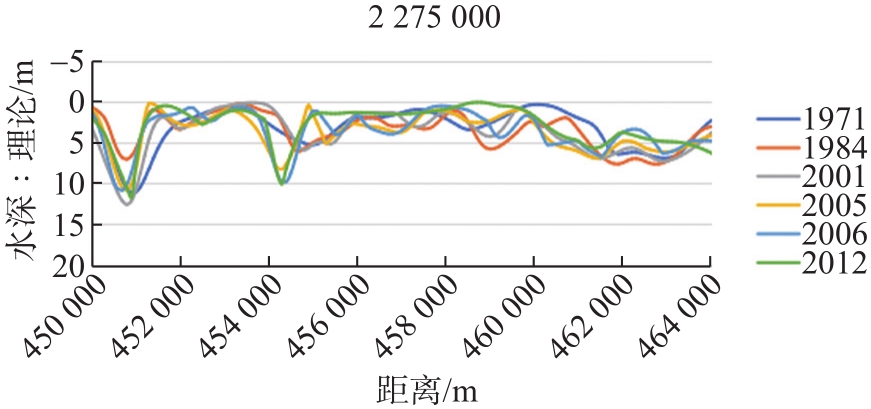
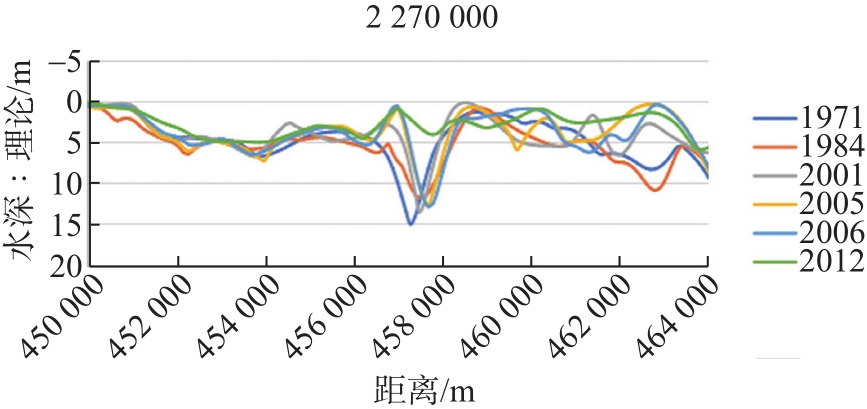
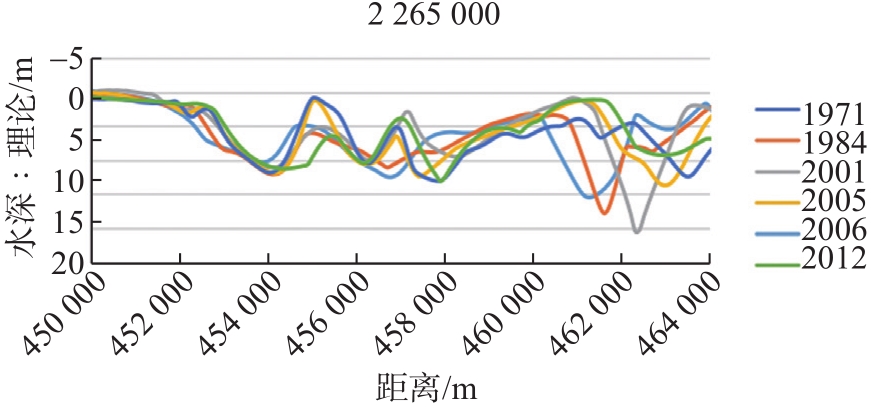
  • 为了分析区域海床稳定性,收集了近十年来附近海域4条断面数据,断面位置图如图1所示。通过分析5条断面处水深的变化判断区域海床的稳定性。

    Figure 1.  Section Location Plan

    5条断面位置水深变化图如图2所示。

    Figure 2.  Depth change chart of section position

    Figure 2.  Depth change chart of section position

    Figure 2.  Depth change chart of section position

    Figure 2.  Depth change chart of section position

    Figure 2.  Depth change chart of section position

    分析以上数据可以看出8#风机位置所处的海域断面线处于不断调整变化状态,变化趋势是水域南侧深槽逐渐分离,沙向东北部输送,海床变化较大,尤其是浅滩和深槽位置发生了整体性的移动;总体上来看海滩面为冲刷态势,南、北深槽东侧为淤积态势,西侧部分为冲刷,滩槽东、西摆动变化大,有向西推进的趋势。因此开展此海域所处的风机基础水下地形监测是非常有必要的。

  • 为了完成此次风机位的水下地形监测任务,本项目采用多波束测深系统、PosMV定姿定位系统、声速剖面仪等设备进行外业的数据采集。所有设备在作业前都通过了设备鉴定,状态稳定,运行状况良好。

    测线布置:按照事先布设好的主测线,对测区进行全覆盖式的水深测量,同时保证相邻测线间有不少于20%的重叠度。除了主测线之外布设了检查测线,检测线长度占总长度的10%,多于规范要求的5%。

    多波束安装:多波束换能器采用船舷安装,多波束换能器与PosMV定姿定位系统的IMU刚性连接安装于船底水面以下;X轴正方向指向船头,安装底部应当稳固并同换能器发射平面保持空间平行的关系。

    多波束校正:在进行多波束测量之前,需要对横摇差(Roll)、纵摇差(Pitch)、艏摇差(Yaw)及船舶动吃水测定等参数进行校正,校正方法按照对应的方法进行。利用软件计算出校正参数直接应用到多波速系统配置文件中,改正系统固定偏差。

    数据采集:外业采集数据使用多波束控制软件和数据采集软件。采集的过程中控制好作业船的船速,记录好吃水的变化。

    2019年至2020年期间,我们共进行了6次监测。外业数据采集时间如表1所示。

    观测次数作业时间
    第一次 (L1)2019年04月21日
    第二次 (L2)2020年04月20日
    第三次 (L3)2020年05月29日
    第四次 (L4)2020年08月08日
    第五次 (L5)2020年09月27日
    第六次 (L6)2020年11月02日

    Table 1.  Field data collection schedule

  • 多波束数据处理采用CARIS HIPS软件,在处理前,检查各传感器的偏移量、系统校准参数等相关数据的准确性8。具体操作流程:创建新项目,建立船型文件;声速文件及潮位文件的编辑;数据进行潮位改正、声速改正;编辑水深数据;生成水深曲面;输出数据文件。

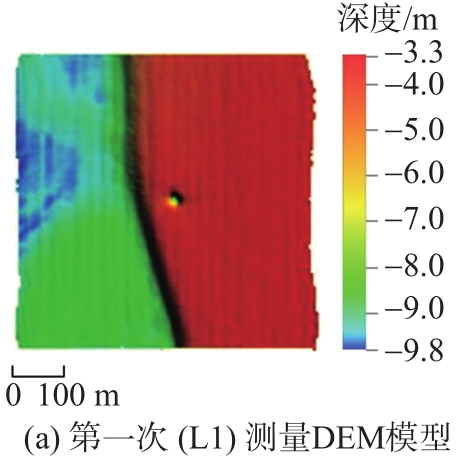
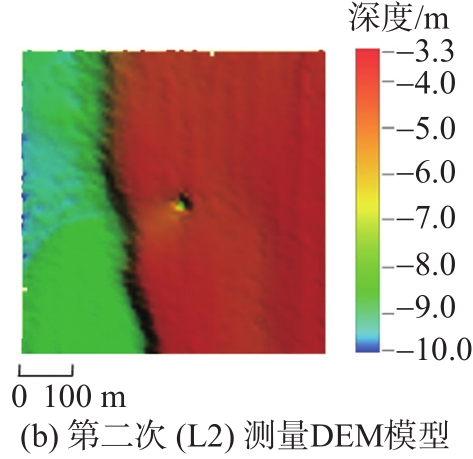
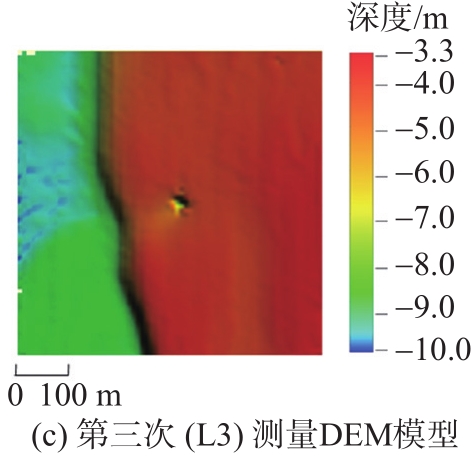
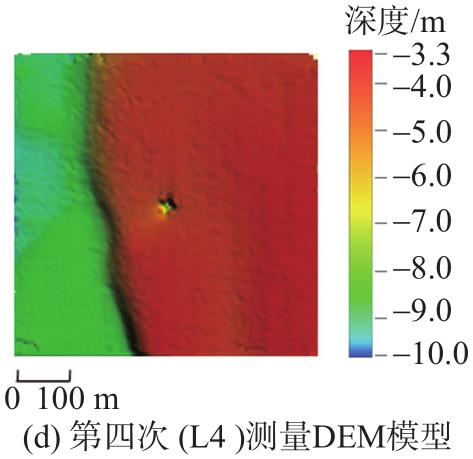
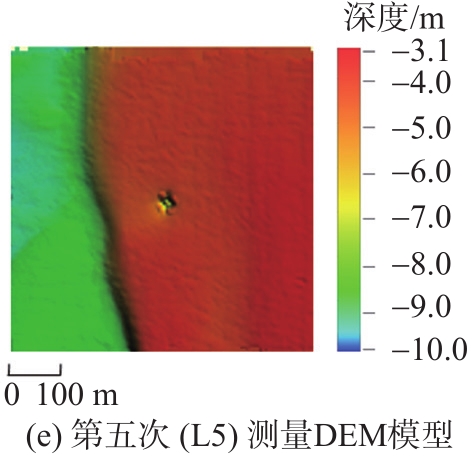
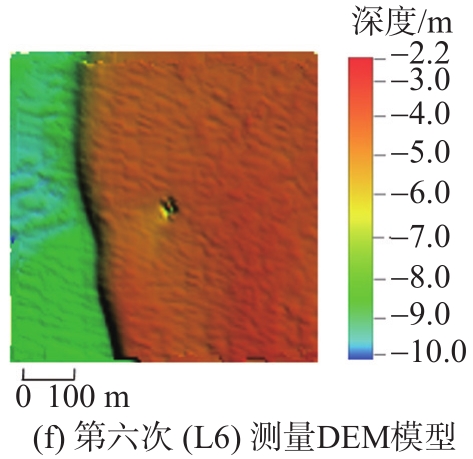
    将ASCII文件格式的文件转换成1 m网格尺寸的DEM数据。根据水深值的不同对DEM数据用不同的颜色进行分层次赋色,采用水下地形渲染图的方式来表现水下地形信息9。在统一的坐标系(WGS84)和高程基准中构建的不同时期水下数字地形DEM模型如图3所示。

    Figure 3.  DEM models of underwater terrain in different periods

    Figure 3.  DEM models of underwater terrain in different periods

    Figure 3.  DEM models of underwater terrain in different periods

    Figure 3.  DEM models of underwater terrain in different periods

    Figure 3.  DEM models of underwater terrain in different periods

    Figure 3.  DEM models of underwater terrain in different periods

    从不同时期的水下地形DEM模型可以看出,风机基础中心往西约60 m处有一条南北走向的海底斜坡。随着时间的推移,其位置发生了明显变化,逐步往西移动,最大位移量约90 m,同时对斜坡位置高程进行了比较,最大变化约4.5 m,风机基础周边的地形出现较严重的淤积现象,这可能对风机基础的安全有一定的影响。

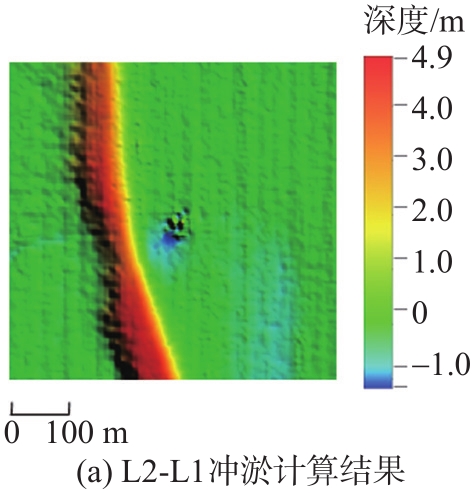
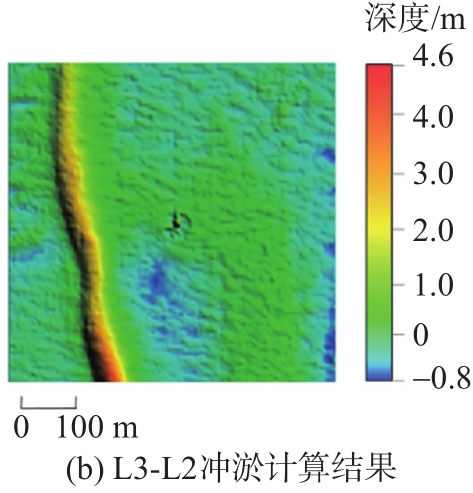
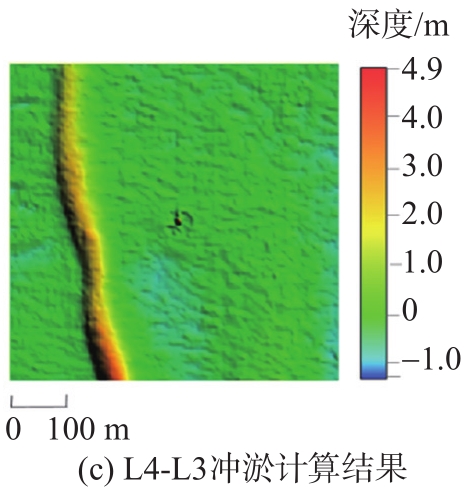
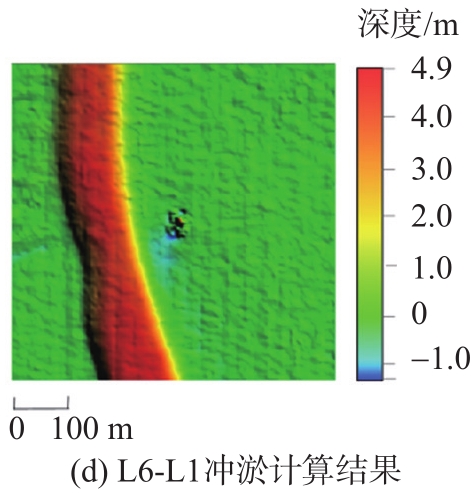
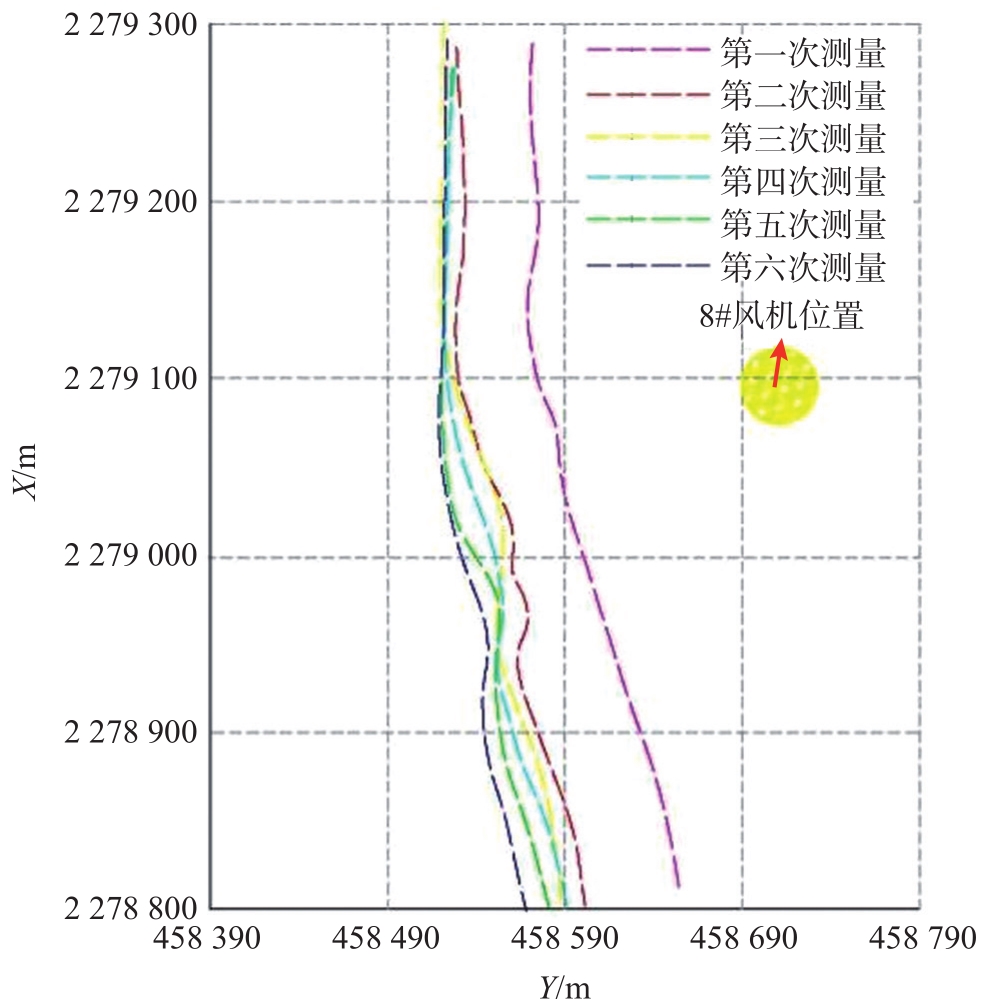
  • 应用不同时期的DEM模型进行区域体积计算,通过不同模型的叠加运算,计算两者的差异,从而判断所在区域冲淤变化情况10-11。对6次测量的成果进行叠加运算,其结果如表2所示。不同时期DEM叠加运算后的冲淤渲染效果如图4所示。同时对位于风机西面南北走向的海底斜坡进行了分析,其在不同时期的位置如图5所示。

    测量期间冲刷量/m3冲淤情况
    L2-L193 925.922淤积
    L3-L268 083.057淤积
    L4-L351 169.581淤积
    L5-L427 137.899淤积
    L6-L510 769.210淤积
    L6-L1251 085.699淤积

    Table 2.  Statistical of DEM superposition calculation results in different periods

    Figure 4.  Effect of erosion and siltation after DEM superposition operation in different periods

    Figure 4.  Effect of erosion and siltation after DEM superposition operation in different periods

    Figure 4.  Effect of erosion and siltation after DEM superposition operation in different periods

    Figure 4.  Effect of erosion and siltation after DEM superposition operation in different periods

    Figure 5.  Seabed slope location map of different periods

    通过表2可以看出,从第一次测量到第六次测量这期间,淤积量达251 085.699 m3,可见本区域内淤积程度还是比较严重。从不同时期的冲淤渲染效果图和不同时期海底斜坡位置图可以看出,第二次测量与第一次测量期间,在一年的时间内该区域有严重的淤积情况,个别位置淤积厚度达4.6 m,海底斜坡位移最大量达62 m;第三次测量到第六次测量期间,淤积量有所减少,海底斜坡位置偏移变化较小,说明整个区域内的冲淤情况较稳定,但还是有少量的泥沙不断堆积,这对风机基础的稳定会造成一定的影响,应引起风机运维单位的足够重视。

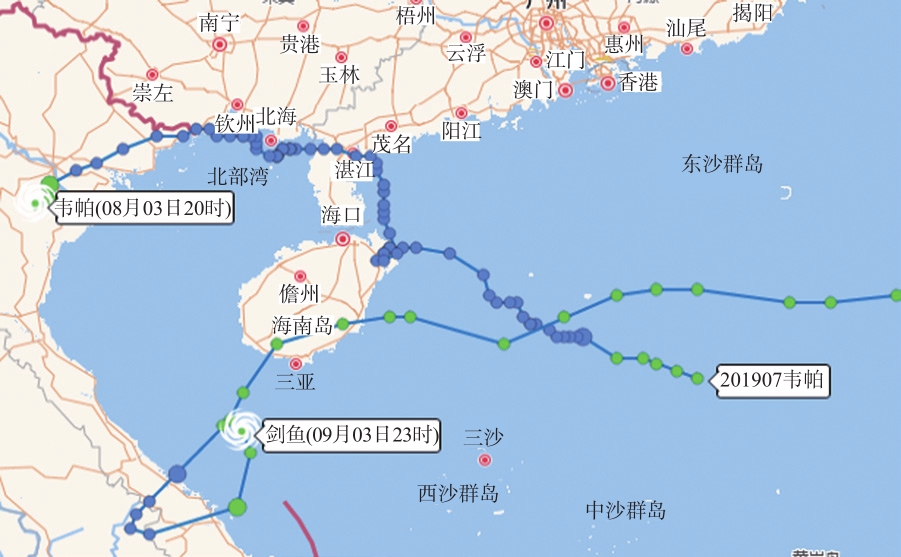
  • 通过对以上资料分析,可以看出风机附近海域局部淤积现象比较严重。局部受到风浪作用,冲刷侵蚀现象比较明显,特别是在台风浪时期会导致海床泥沙剧烈冲刷搬运,使地形短时期内产生较大变化。2019年4月至2020年4月之间影响工程海域的2场台风过程如图6所示,可知1907号“韦帕”台风路径正好经过工程海域,综合分析认为8#风机西侧的大范围淤积很可能与这次台风经过有关。

    Figure 6.  The Track of typhoon Wipha (No.1907)

    此外,泥沙在潮流和波浪的联合作用和沿岸流作用下运移,这是该海域海床地形局部冲刷和淤积的另一个重要原因。工程区附近海底沉积物主要以细砂、中细砂和粉砂质砂为主,在较强的海域潮流动力下,使得泥沙活动性强。采用武汉水利电力学院泥沙起动公式12

    Uc=hD0.1417.6ρS-ρρD+6.05×10-710+hD0.720.5 ((1))

    式中:

    Uc ——起动流速(m/s);

    h ——水深(m);

    D ——泥沙中值粒径(m);

    ρs ——泥沙密度(kg/m3);

    ρ ——水体的密度(kg/m3)。

    运用泥沙起动公式计算,工程附近0.1~0.3 mm粒径的泥沙起动流速为在0.20~0.45 m/s。由此可以得知,在一般天气条件下,工程区附近海床泥沙就能起动,然后在潮流的往复作用下产生泥沙输移对海床变化产生影响13。同时工程区附近海域属于波浪动力作用较强的海域,在风浪和潮流共同的作用下,海底泥沙物质将沿岸进行运移,导致出现局部的冲刷和淤积。

  • 为获取高精度的水下地形DEM模型数据,本文采用了多波束测深系统对风机基础周边地形进行了6次监测,通过对高精度的DEM模型进行叠加运算,计算了不同时期的冲刷量,分析了冲刷的原因。本文研究表明:

    1)基于高精度多波束海底地形数据,建立通用的数字高程模型,可以更直观地表现和解释风机周边水下地形,精确地反映水下地形的细节特征。基于DEM的冲淤分析,进一步提高了分析的精度。通过周期监测,对海底斜坡位置的演变进行了定量表达,对后续采取工程措施提供了决策支持。

    2)通过对冲刷原因分析,得出导致本次淤积变化的主要原因是强台风影响到风电场海域时,海床和风机局部区域通常会发生较大的整体性变化。但在正常海况条件下,海底基本处于稳定状态,没有发生较大的冲淤变化过程。因此在后续的日常运维中,建议进一步加强风机局部范围的海底地形监测,为风电场的正常运营提供安全保障。

    随着三维点云数据库和可视化技术的不断发展,利用三维点云数据库,通过对比研究可以提供水下地形的冲刷淤积的变化,利用三维可视化专业软件可以真实地反映水下三维地形环境,实现海底地形三维可视化成图。

Reference (13)

Catalog

    /

    DownLoad:  Full-Size Img  PowerPoint
    Return
    Return