• Peer Review
  • Non-profit
  • Global Open Access
  • Green Channel for Rising Stars
Volume 9 Issue 1
Mar.  2022
Turn off MathJax
Article Contents

HE Naping,XIAO Guofeng,LIN Xue,et al.Simulation and Optimization of Airflow Organization from Nozzle Side of Air Conditioning in UHV Flexible DC Valve Hall[J].Southern Energy Construction,2022,09(01):86-95. doi:  10.16516/j.gedi.issn2095-8676.2022.01.013
Citation: HE Naping,XIAO Guofeng,LIN Xue,et al.Simulation and Optimization of Airflow Organization from Nozzle Side of Air Conditioning in UHV Flexible DC Valve Hall[J].Southern Energy Construction,2022,09(01):86-95. doi:  10.16516/j.gedi.issn2095-8676.2022.01.013

Simulation and Optimization of Airflow Organization from Nozzle Side of Air Conditioning in UHV Flexible DC Valve Hall

doi: 10.16516/j.gedi.issn2095-8676.2022.01.013
  • Received Date: 2021-04-08
  • Rev Recd Date: 2021-08-03
  • Publish Date: 2022-03-25
  •   Introduction  The ultra-high voltage flexible DC valve hall has the characteristics of high height, large volume, and large heat generation of equipment. The air supply mode of the air conditioning in the valve hall can significantly affect the indoor temperature field, wind speed field, and pressure field. It is very important to study the air supply mode of air conditioning in valve hall to ensure the normal operation of heating equipment in valve hall.  Method  Ansys Fluent 19.2, a CFD simulation software, was used to simulate the valve hall in the horizontal side air supply mode of the spherical nozzle, and the problems in the temperature field, wind speed field and pressure field were analyzed. And they were improved by changing the air supply angle. In this study, three kinds of air supply angles were set for simulation : i=10°, i=20°, i=30°.  Result  In the case of the horizontal side air supply mode of the spherical nozzle, the average temperature of the air in the valve hall is 30.30 ℃, and the average temperature, maximum temperature, and minimum temperature of the valve body surface are 52.91 ℃, 62.93 ℃, 43.55 ℃ respectively. There is local high temperature on the valve body surface. When i=30°, the lowest average indoor air temperature is 30.27 ℃, and there is less static air area around the valve body. The lower limit of the maximum surface temperature of the valve body at four air supply angles is 61.66 ℃; when i=10° and 20°, the average air temperature in the valve hall is respectively 30.40 ℃, 30.45 ℃, the highest temperature of the valve body surface at these two air supply angles exceeds 63 ℃.  Conclusion  The best inclination angle of the spherical nozzle air supply in summer in the UHV flexible DC valve hall is 30°.
  • [1] 石骁. 特高压柔直换流站阀厅屋盖结构选型与优化 [J]. 南方能源建设, 2018, 5(4): 98-104. DOI:  10.16516/j.gedi.issn2095-8676.2018.04.015.

    SHIX. Selection and optimization of the roof structure of the valve hall of the UHV DC converter station [J]. Southern Energy Construction,2018,5(4): 98-104. DOI:  10.16516/j.gedi.issn2095-8676.2018.04.015.
    [2] 苟少清. 特高压柔直阀厅室内气流组织的CFD模拟研究 [D]. 北京: 北京交通大学, 2010.

    GOUS Q. CFD simulation study on air distribution in the valve hall of converter station [D]. Beijing: Beijing Jiao Tong University, 2010.
    [3] 李慧. 换流站阀厅空调气流组织模拟分析 [J]. 建筑热能通风空调, 2017, 36(1): 72-75. DOI:  10.3969/j.issn.1003-0344.2017.01.017.

    LIH. Simulation analysis of airflow organization of air conditioning in converter station valve hall [J]. Building thermal ventilation and air conditioning, 2017, 36(1): 72-75. DOI:  10.3969/j.issn.1003-0344.2017.01.017.
    [4] 张吉超, 王青. 喷口送风在大空间区域的应用与探讨 [J]. 节能, 2015, 34(6): 57-59. DOI:  10.3969/j.issn.1004-7948.2015.06.015.

    ZHANGJ C, WANGQ. Application and discussion of nozzle air supply in large space area [J]. Energy Conservation, 2015, 34(6): 57-59. DOI:  10.3969/j.issn.1004-7948.2015.06.015.
    [5] 张欢, 杨紫维, 由世俊, 等. 某建筑中庭气流组织的数值模拟 [J].暖通空调, 2014, 44(11): 75-80.

    ZHANGH, YANGZ W, YOUS J, et al. Numerical simulation of air distribution in the atrium of a building [J]. Heating Ventilating and Air Conditioning, 2014, 44(11): 75-80.
    [6] 张晓华. 三峡左岸电站暖通空调系统设计与运行 [J]. 暖通空调, 2012, 42(9): 95-99+18. DOI:  10.3969/j.issn.1002-8501.2012.09.022.

    ZHANGX H. Design and operation of the HVAC system of the three gorges left bank power station [J]. Heating Ventilating and Air Conditioning, 2012, 42(9): 95-99+18. DOI:  10.3969/j.issn.1002-8501.2012.09.022.
    [7] 沈晟炜, 陈诚. 上海某博览馆空调系统球形送风口CFD模拟 [J]. 节能, 2018, 37(4): 15-18. DOI:  10.3969/j.issn.1004-7948.2018.04.006.

    SHENS W, CHENC. CFD simulation of the spherical air outlet of the air-conditioning system of an Expo in Shanghai [J]. Energy Conservation, 2018, 37(4): 15-18. DOI:  10.3969/j.issn.1004-7948.2018.04.006.
    [8] 蔡宁, 王梦迪, 李志浩, 等. 大空间建筑夏季喷口送风工况下室内空气垂直温度分布试验研究 [J]. 南京理工大学学报, 2019, 43(5): 600-606. DOI:  10.14177/j.cnki.32-1397n.2019.43.05.009.

    CAIN, WANGM D, LIZ H, et al. Experimental study on the vertical temperature distribution of indoor air under the condition of summer nozzle air supply in large space buildings [J]. Journal of Nanjing University of Science and Technology, 2019, 43(5): 600-606. DOI:  10.14177/j.cnki.32-1397n.2019.43.05.009.
    [9] 赵彬, 林波荣, 李先庭, 等. 室内空气分布的预测方法及比较 [J]. 暖通空调, 2001(4): 82-86. DOI:  10.3969/j.issn.1002-8501.2001.04.026.

    ZHAOB, LINB R, LIX T, et al. Prediction methods and comparison of indoor air distribution [J]. HVAC, 2001(4): 82-86. DOI:  10.3969/j.issn.1002-8501.2001.04.026.
    [10] 王福军. 流体机械旋转湍流计算模型研究进展 [J]. 农业机械学报, 2016, 47(2): 1-14. DOI:  10.6041/j.issn.1000-1298.2016.02.001.

    WANGF J. Research progress on calculation models of rotating turbulence in fluid machinery [J]. Transactions of the Chinese Society of Agricultural Machinery, 2016, 47(2): 1-14. DOI:  10.6041/j.issn.1000-1298.2016.02.001.
    [11] 金新阳, 杨伟, 金海, 等. 数值风工程应用中湍流模型的比较研究 [J]. 建筑科学, 2006(5): 1-5+28. DOI:  10.3969/j.issn.1002-8528.2006.05.001.

    JINX Y, YANGW, JINH, et al. Application of turbulence model in numerical wind engineering comparative research [J]. Building Science, 2006(5): 1-5+28. DOI:  10.3969/j.issn.1002-8528.2006.05.001.
    [12] 李琼, 持田灯, 孟庆林, 等. 建筑室外风环境数值模拟的湍流模型比较 [J]. 华南理工大学学报(自然科学版), 2011, 39(4): 121-127. DOI:  10.3969/j.issn.1000-565X.2011.04.022.

    LIQ,CHIT D,MENGQ L,et al. Comparison of turbulence models for numerical simulation of outdoor wind environment in buildings [J]. Journal of South China University of Technology (Natural Science Edition) , 2011, 39(4): 121-127. DOI:  10.3969/j.issn.1000-565X.2011.04.022.
    [13] 谢海英, 张双, 关欣. 湍流模型和壁面函数对室内空气流动数值模拟的影响 [J]. 上海理工大学学报, 2017, 39(1): 81-85. DOI:  10.13255/j.cnki.jusst.2017.01.014.

    XIEH Y, ZHANGS, GUANX. Influence of turbulence model and wall function on numerical simulation of indoor air flow [J]. Journal of University of Shanghai for Science and Technology, 2017, 39(1): 81-85. DOI:  10.13255/j.cnki.jusst.2017.01.014.
    [14] 王亚冲, 陈景鹏, 崔村燕, 等. 受限空间内湍流模型对气体扩散仿真结果的影响 [J]. 中国安全生产科学技术, 2016, 12(7): 123-127. DOI:  10.11731/j.issn.1673-193x.2016.07.022.

    WANGY C, CHENJ P, CUIC Y, et al. Influence of turbulence model on gas diffusion simulation results in confined space [J]. China Work Safety Science and Technology, 2016, 12(7): 123-127. DOI:  10.11731/j.issn.1673-193x.2016.07.022.
    [15] MERONEY ROBERTN. CFD modeling of dense gas cloud dispersion over irregular terrain [J]. Journal of Wind Engineering & Industrial Aerodynamics, 2012 (104-106): 500-508. DOI:  10.1016/j.jweia.2012.01.001.
  • 通讯作者: 陈斌, bchen63@163.com
    • 1. 

      沈阳化工大学材料科学与工程学院 沈阳 110142

    1. 本站搜索
    2. 百度学术搜索
    3. 万方数据库搜索
    4. CNKI搜索

Figures(29)  / Tables(3)

Article Metrics

Article views(205) PDF downloads(21) Cited by()

Related

Simulation and Optimization of Airflow Organization from Nozzle Side of Air Conditioning in UHV Flexible DC Valve Hall

doi: 10.16516/j.gedi.issn2095-8676.2022.01.013

Abstract:   Introduction  The ultra-high voltage flexible DC valve hall has the characteristics of high height, large volume, and large heat generation of equipment. The air supply mode of the air conditioning in the valve hall can significantly affect the indoor temperature field, wind speed field, and pressure field. It is very important to study the air supply mode of air conditioning in valve hall to ensure the normal operation of heating equipment in valve hall.  Method  Ansys Fluent 19.2, a CFD simulation software, was used to simulate the valve hall in the horizontal side air supply mode of the spherical nozzle, and the problems in the temperature field, wind speed field and pressure field were analyzed. And they were improved by changing the air supply angle. In this study, three kinds of air supply angles were set for simulation : i=10°, i=20°, i=30°.  Result  In the case of the horizontal side air supply mode of the spherical nozzle, the average temperature of the air in the valve hall is 30.30 ℃, and the average temperature, maximum temperature, and minimum temperature of the valve body surface are 52.91 ℃, 62.93 ℃, 43.55 ℃ respectively. There is local high temperature on the valve body surface. When i=30°, the lowest average indoor air temperature is 30.27 ℃, and there is less static air area around the valve body. The lower limit of the maximum surface temperature of the valve body at four air supply angles is 61.66 ℃; when i=10° and 20°, the average air temperature in the valve hall is respectively 30.40 ℃, 30.45 ℃, the highest temperature of the valve body surface at these two air supply angles exceeds 63 ℃.  Conclusion  The best inclination angle of the spherical nozzle air supply in summer in the UHV flexible DC valve hall is 30°.

HE Naping,XIAO Guofeng,LIN Xue,et al.Simulation and Optimization of Airflow Organization from Nozzle Side of Air Conditioning in UHV Flexible DC Valve Hall[J].Southern Energy Construction,2022,09(01):86-95. doi:  10.16516/j.gedi.issn2095-8676.2022.01.013
Citation: HE Naping,XIAO Guofeng,LIN Xue,et al.Simulation and Optimization of Airflow Organization from Nozzle Side of Air Conditioning in UHV Flexible DC Valve Hall[J].Southern Energy Construction,2022,09(01):86-95. doi:  10.16516/j.gedi.issn2095-8676.2022.01.013
  • 特高压柔性直流阀厅,由于采用特殊的特高压柔性直流输电换流阀,对空气净距有特殊要求,其建筑面积、建筑高度远超以往工程1,同时,阀厅内设备发热量巨大,需设置通风或空调系统进行降温,使阀厅温度控制在一定的范围内,保证阀厅内电气设备稳定安全运行2-3

    特高压柔直阀厅一般设置全空气集中空调系统。受阀厅内部结构的影响,阀厅内空调气流组织一般有三种型式4:(1)上送风方式,送风口常安装在大厅的顶棚上,回风口设在周边侧墙或顶棚上;(2)下送风方式,送风口安装在地面上,回风口设在顶棚或侧墙上部;(3)侧送风方式,送风口安装在大厅周边侧墙,回风口布置在送风口同侧下方5-6。其中,侧送风方式是高大空间采用最广泛的一种送风形式,送风口通常为球形喷口,喷口送风角度不同,会显著影响室内流场分布,可通过调整喷口送风角度来改善室内热环境7-8

    对于特高压柔直阀厅这种高大空间,非等温的室内气流受到浮升力和高大空间的双重作用,使得室内流场十分复杂,难以采用常规的实验测量手段对阀厅内气流组织或热环境进行评价。目前建筑领域采用的气流组织设计方法主要有四种:射流公式法、区域化模型法、模型实验法和计算流体力学法(Computational Fluid Dynamics,CFD)9。从预测成本、周期、模拟的准确性及复现性等方面综合考虑,目前最为理想的阀厅内气流组织设计方法是CFD法。

    本文以国家西电东送重点工程乌东德电站送电广东广西特高压多端柔性直流示范工程中的龙门换流站特高压柔性直流极1高端阀厅为研究对象(后文中由“阀厅”一词指代),采用Ansys Fluent 19.2软件对球形喷口侧送方式下的阀厅进行模拟仿真,通过分析其温度场、风速场、压力场存在的问题,考虑从送风角度进行改善,最后得到最有效的喷口送风角度。

  • 龙门换流站主体部分共有4个阀厅:极1高端阀厅、极1低端阀厅、极2高端阀厅、极2低端阀厅。本次研究的是极1高端阀厅。阀厅内放置有换流阀、电抗器、避雷器、接地开关、电流测量装置、电压测量装置等诸多设备,其中换流阀是直流输配工程的核心部件之一,其正常运行对整个输电系统的安全稳定至关重要。阀厅内的主要发热设备即为换流阀。换流阀运行过程中会通过辐射及对流传热的方式向阀厅散发很大的热量,为保证换流阀体的安全运行,阀厅内温度按夏季不超过45 ℃,冬季不能低于10 ℃设计,相对湿度全年控制在10%~60%。

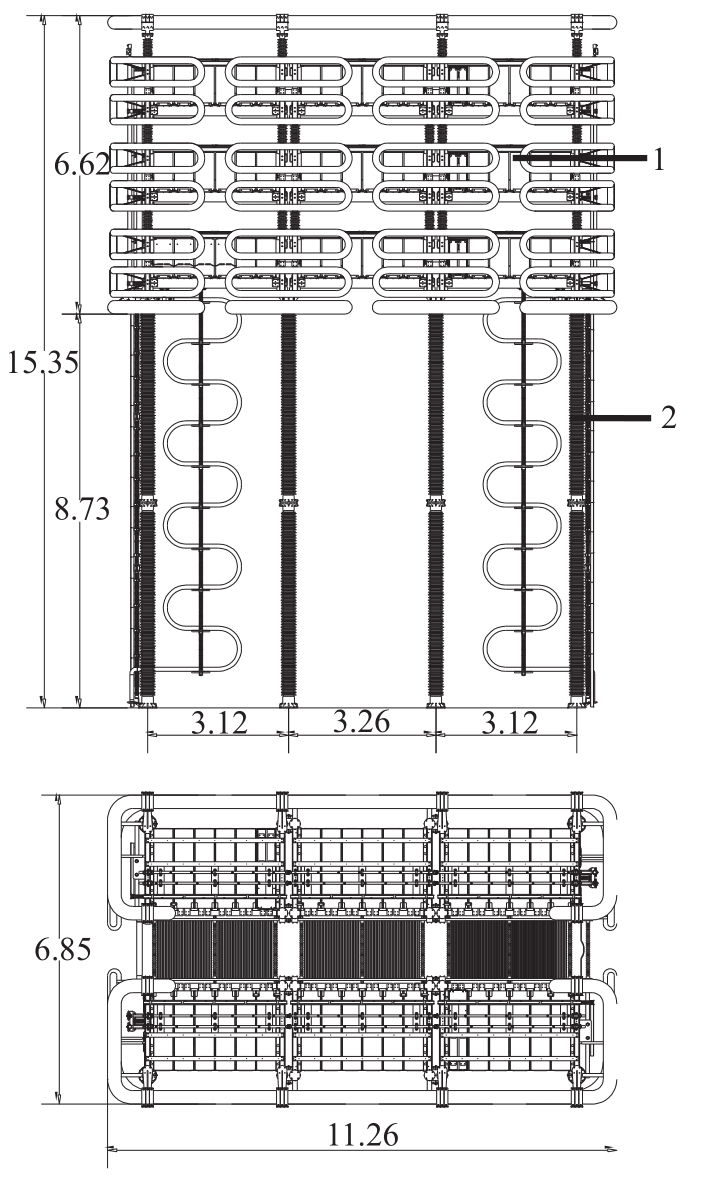
    阀厅尺寸为90.5 m × 87.25 m × 43.3 m(长×宽×高)。阀厅内主要发热设备换流阀布置在阀厅中央,单个阀厅换流阀由6个桥臂组成,每个桥臂由两个阀塔串联组成,共12个阀塔,单个阀塔长11.26 m,宽6.85 m,高15.35 m(其中绝缘子高度8.73 m,起支撑阀体的承重作用,不考虑发热;阀组本体高度6.62 m,考虑发热)。换流阀的总发热量为800 kW。阀塔外形图如图1所示。

    Figure 1.  Valve tower outline drawing

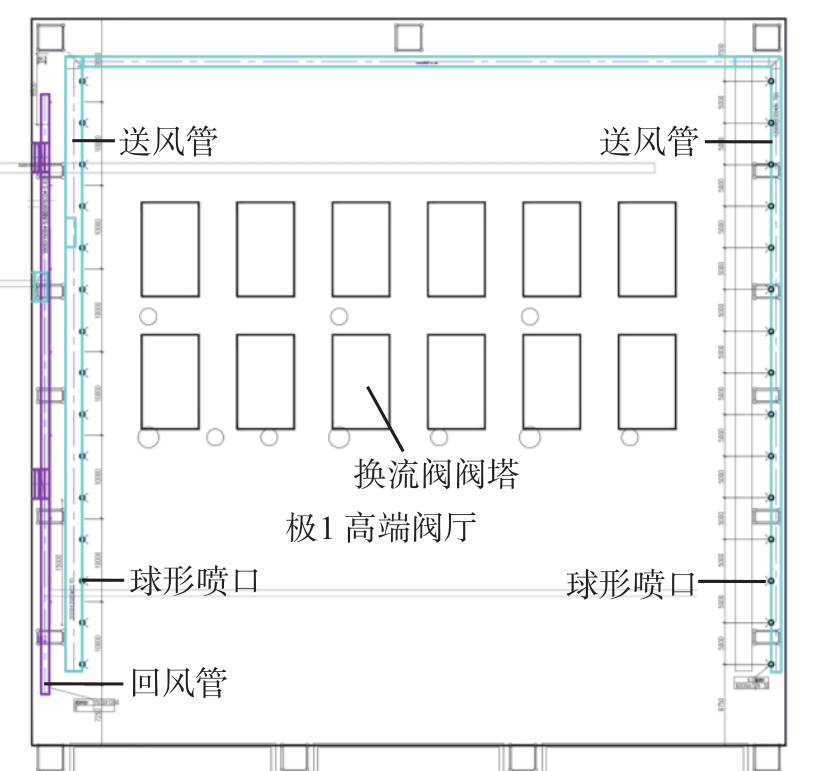
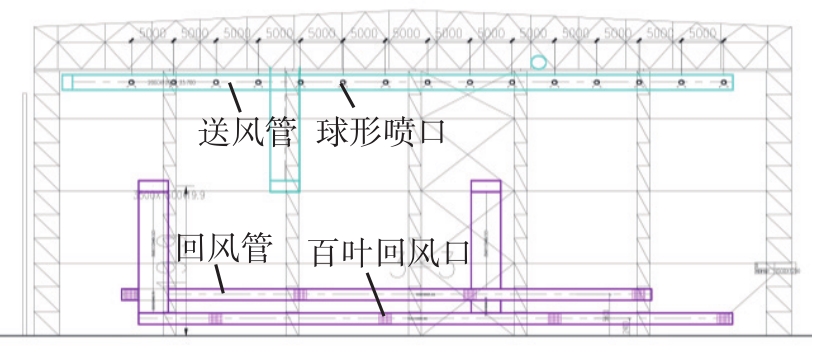
    送风管贴着阀厅网架下布置,通过双侧球形喷口侧送风,回风管布置在靠阀厅靠空调机房侧墙下部。具体送风布置图如图2所示。

    Figure 2.  Valve hall side air supply mode plan

    Figure 2.  Valve hall side air supply mode plan

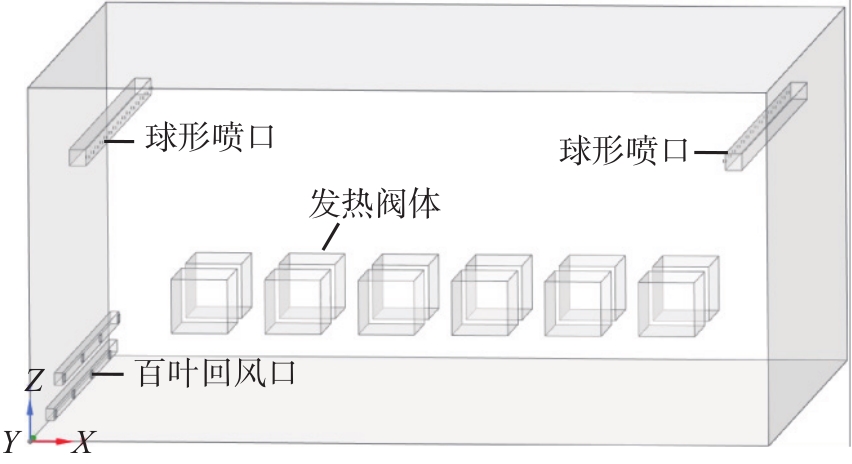
  • 采用AutoCAD及SpaceClaim合作建模,在保留阀厅与空调送风系统布置方案的几何特征与物理性能的前提下,对阀厅作部分简化。将换流阀阀组本体(发热)简化为长方体;考虑到绝缘子(不发热)及阀塔悬挂附件尺寸较小,对气流组织影响很小,将该部分忽略;最终换流阀模型仅保留阀组主体部位。球形喷口简化为圆柱体,水平送风,回风口为长方体,风口规格数量如表1所示。简化之后的阀厅模型如图3所示。

    风口数量/个规格/mm风口风量/(m3·h-1
    球形喷口30Ф6306 000
    百叶回风81 500 × 1 200

    Table 1.  Number of air outlet specifications

    Figure 3.  Valve hall model diagram

  • 为开展数值计算,对模拟的物理现象作如下假设:

    1)阀厅内空气低速流动,视为不可压流体,符合Boussinesq基本假设,忽略空气的压缩性带来的密度变化。

    2)忽略由空气粘滞力做功引起的耗散热对温度的影响。

    3)空气流动视为稳态湍流。

    4)视阀厅内空气为辐射透明介质,忽略建筑墙壁及阀厅内物体对其的辐射换热。

    5)不考虑门的影响。

    6)忽略漏风影响,认为房间气密性良好。

  • CFD数值模拟过程中,湍流模型的选择和设置决定了迭代算法,对仿真结果的精度和速度起着至关重要的作用。由于机械送回风口和内部热源的存在,阀厅内空气常为强制对流和自然对流相结合的混合流动,流场多处于湍流区。室内环境研究常用湍流模型有:Standard k-ε 模型、RNG k-ε 模型、Realizable k-ε 模型等。各模型特点及适用范围如表2所示。

    模型特点适用范围
    Standardk-ε高雷诺数湍流模型10普遍适用于工程中较简单的模型,对近壁区流动或存在旋流和绕流的情况不适用10
    RNGk-ε修正湍动粘度考虑了平均流动中的旋转及旋流情况,同时在ε方程中增加了反映主流时均应变率的一项10-13适用于带旋流、高应变率流动及流线弯曲程度较大的流动
    Realizablek-ε在湍动粘度中引入了与旋转和曲率有关的内容,根据均方涡量脉动动态方程修正了耗散率方程10-13适用于旋转均匀剪切流、包含有射流和混合流的自由流动

    Table 2.  Commonly used turbulence models in tall spaces

    在本次模拟中,考虑近壁面流动,由于Standard k-ε 不适用于近壁区流动情况,所以考虑上表后两种模型。参考相关文献显示Realizable k-ε 更适用于包含有射流的自由流动,且文献[14-15]通过统计比较得出在受限空间气体扩散仿真模拟中,Realizable k-ε 模型的模拟效果更优异,因此采用Realizable k-ε 湍流模型,近壁面处理采用标准壁面函数。使用SIMPLE算法来解决压力与速度耦合的问题,离散方式Gradient采用Least Squares Cell Based,Pressure采用Standard,其余各项采用Second Order Upwind。

  • 本研究主要对稳态条件下流体流动过程进行研究,涉及到的主要边界条件如下:

  • 阀厅内由于电气设备发热量远大于围护结构得热量,暂不考虑围护结构与外界的传热,将围护结构设定为绝热边界。

  • 采用速度边界(速度入口,velocity inlet)。按照送风量和送风口的断面面积,计算送风速度,依据负荷计算送风温度,具体送风工况如表3所示。

    参数送风速度/(m·s-1送风温度/℃送风角度/(°)
    数值13.12170

    Table 3.  Spherical nozzle air supply conditions

  • 采用压力边界(压力出口,Pressure outlet)。根据室外大气压设定压力值。

  • 仅关注阀体表面的温度,不关注阀体内部的温度分布,采用第二类边界条件。本研究中依据阀体总发热量和阀体表面积设定阀体表面热流密度为81.083 W/m2

  • 采用Workbench Meshing划分网格。本研究中物理模型较为复杂,特别是送风口为圆柱形且尺寸小,使用非结构化网格,在送回风口处对网格进行加密。

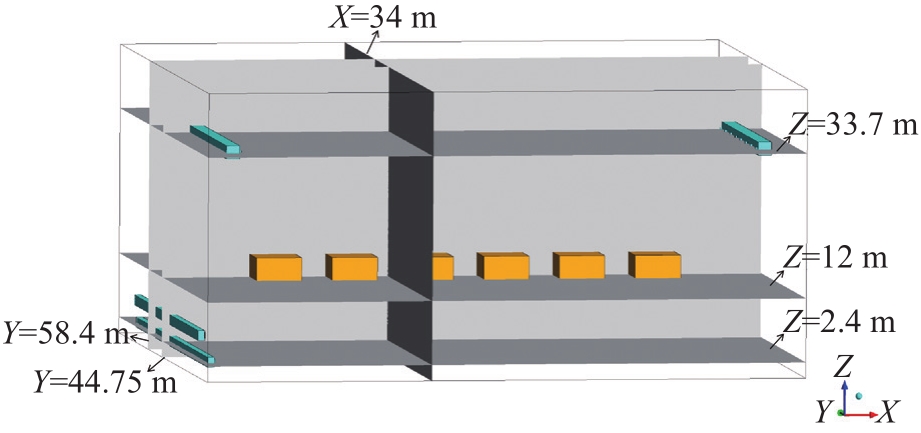
  • 由于阀厅空间较大,并且阀厅内的换流阀布置较为对称,本研究选取比较有代表性的截面作为分析对象。主要截面如图4所示。温度场、速度场和压力场情况见下文。

    Figure 4.  The cross-section location distribution map

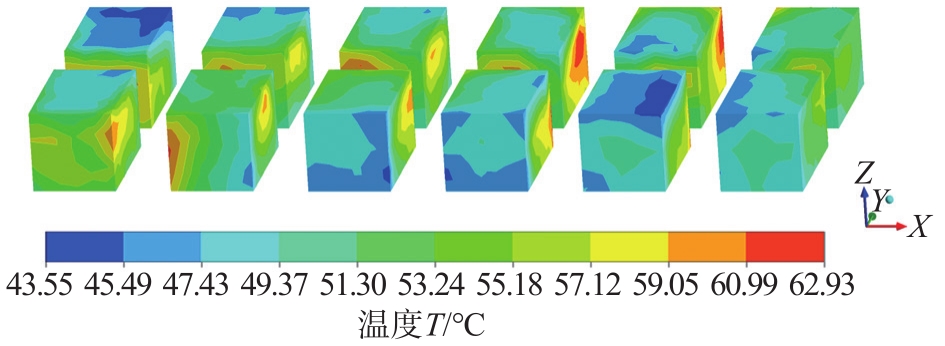
  • 球形喷口水平送风情况下,发热阀体表面温度分布情况如图5所示。

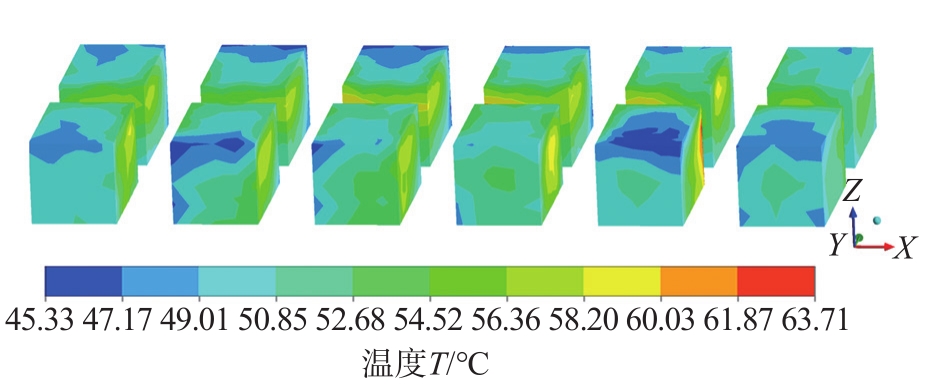
    Figure 5.  Contour map of valve body surface temperature distribution

    阀体表面最高温度为62.93 ℃,最低温度为43.55 ℃,平均温度52.91 ℃,局部高温出现在两排阀体中部表面以及每列阀体相邻的表面,这些地方由于空间狭窄无法和低温空气进行充分的对流传热。Y轴后排阀体表面温度整体较前方阀体温度更高,这是由于前方风口数量更多,送风量较大。Y轴前排6个阀体中,左侧两阀体表面温度较高,右侧四阀体表面温度较低,而后排左侧两阀体表面温度较低,右侧四阀体表面温度较高,说明阀厅送风气流分布不均匀。且X轴中部阀体表面温度较两侧阀体温度更高,考虑是因为阀厅长度较长、两侧球形喷口射程不够所导致。
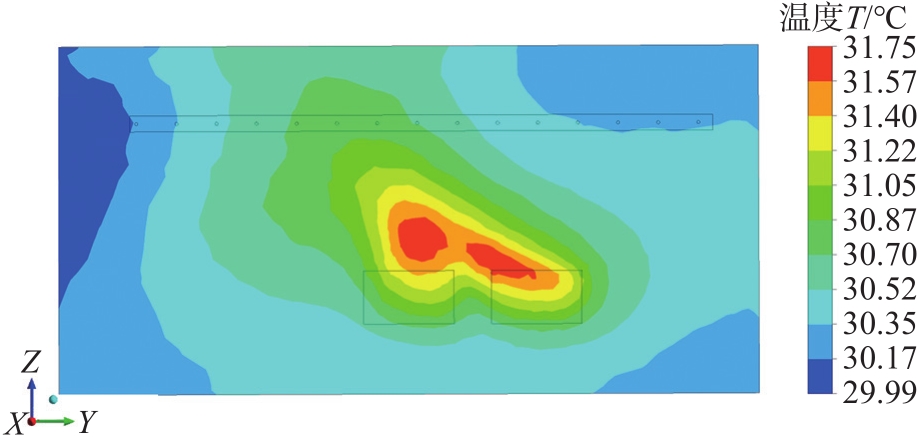
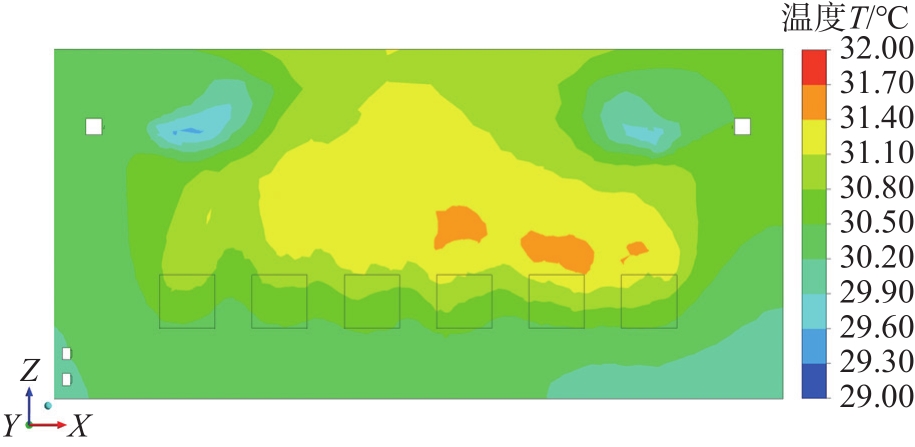
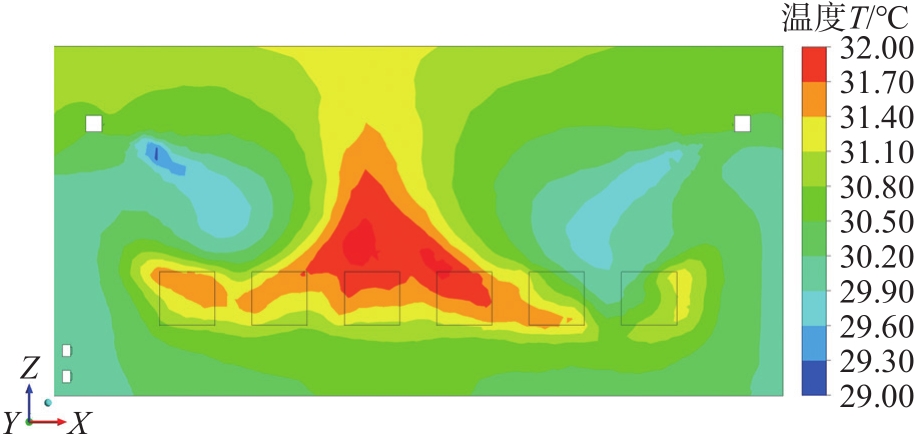
    阀厅内平均空气温度为30.30 ℃,空气温度分布情况如图6图7所示。

    Figure 6.  Section temperature distribution diagram when X=34 m

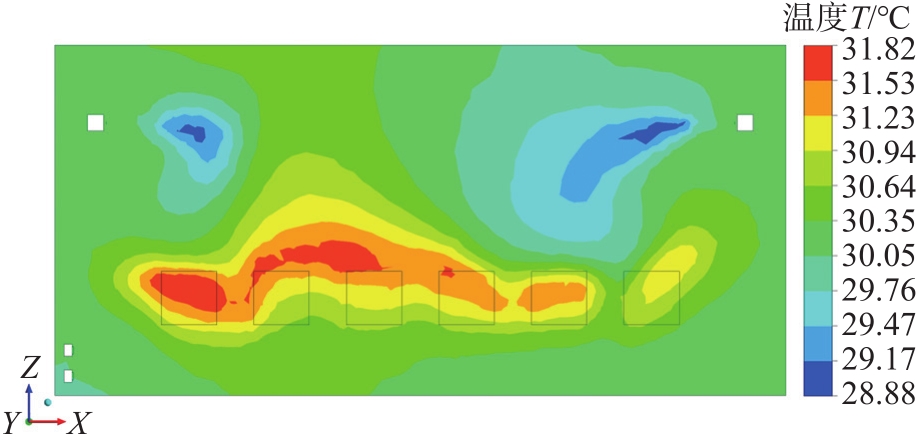
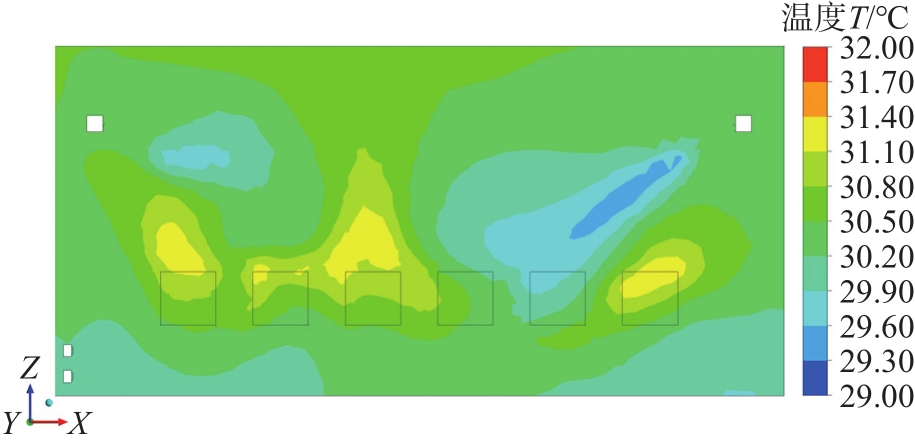
    Figure 7.  Section temperature distribution diagram when Y=52 m

    观察以上温度分布云图可以看出阀厅内空气温度范围为28~32 ℃,贴近阀体周围的空气温度较高,送风口处温度最低,送风气流射流路径空气温度较低。观察图6可知,以阀体顶部为圆心,周围空气温度随半径增大依次递减,温度分布呈现圆环状递减趋势,此外,由图7可知,i=0°时,右侧低温送风气流可到达右侧两阀体顶部,解释了图5所示阀体右侧阀体顶部温度较低的温度分布情况。

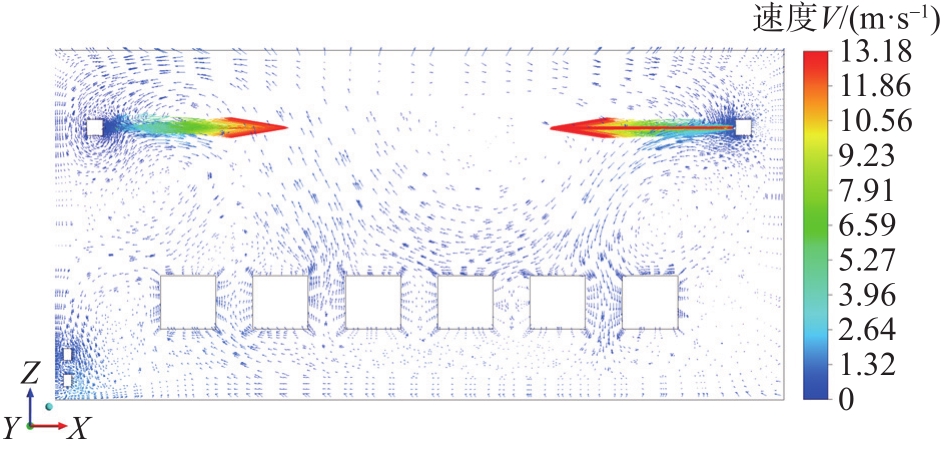
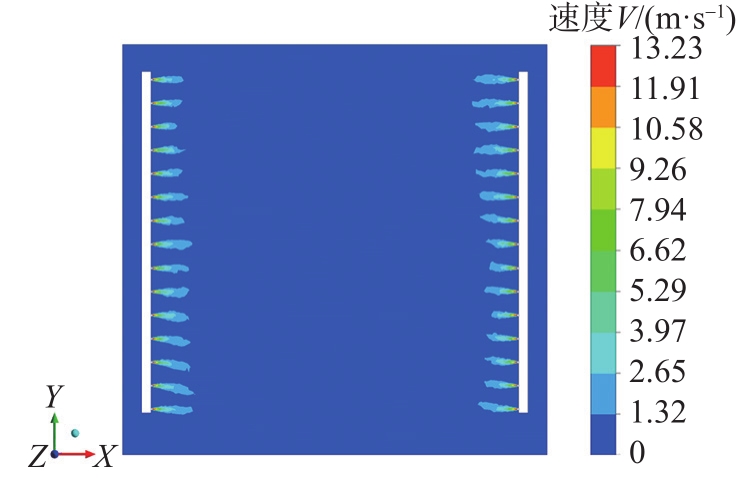
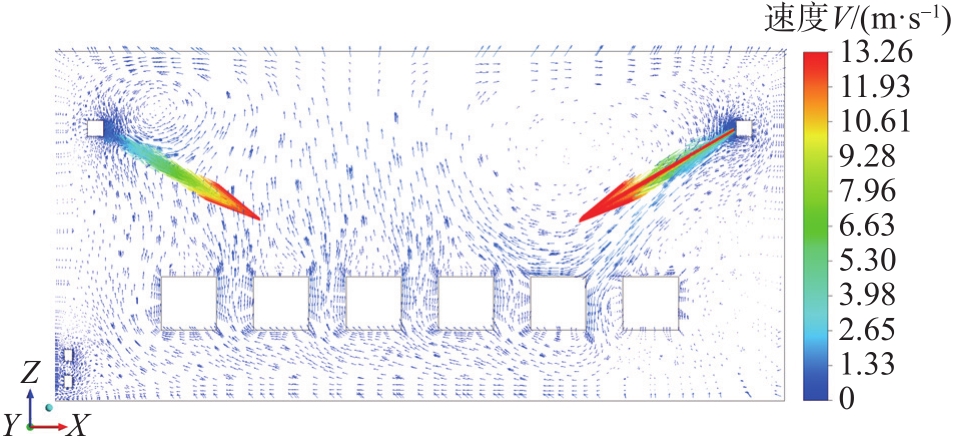
  • 球形喷口水平送风情况下,阀厅内空气平均流速为0.42 m/s,最高流速13.32 m/s,出现在送风口处,回风口最高流速为7.10 m/s。送回风口处速度分布情况如图8图12所示。

    Figure 8.  Ssection (through the air supply outlet) velocity distribution vector diagram when Y=44.75 m

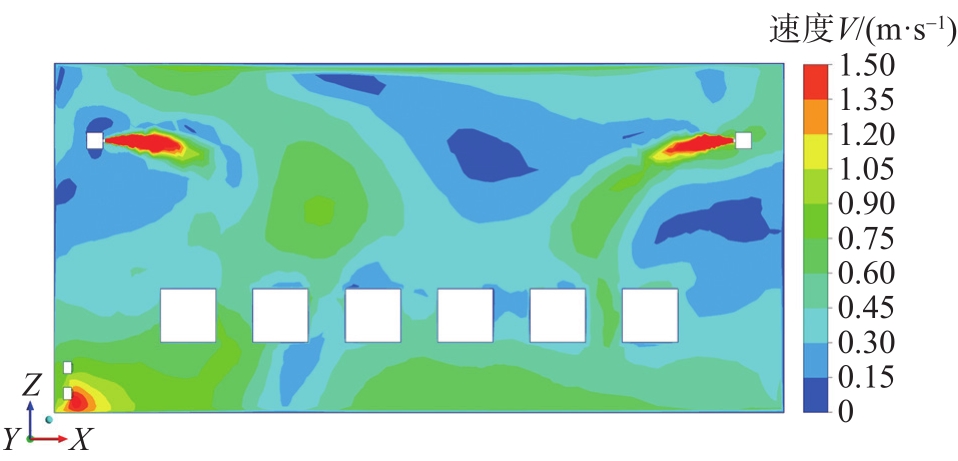
    Figure 9.  Section (through the air supply outlet) velocity distribution cloud map when Z=33.7 m

    Figure 10.  Section (through the air supply outlet) velocity distribution cloud map when Y=44.75 m

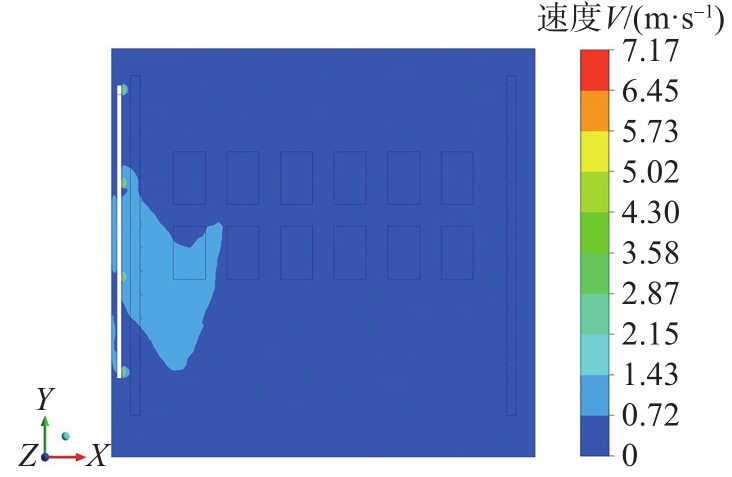
    Figure 11.  Section (passing the return air outlet) velocity distribution cloud map when Z=2.4 m

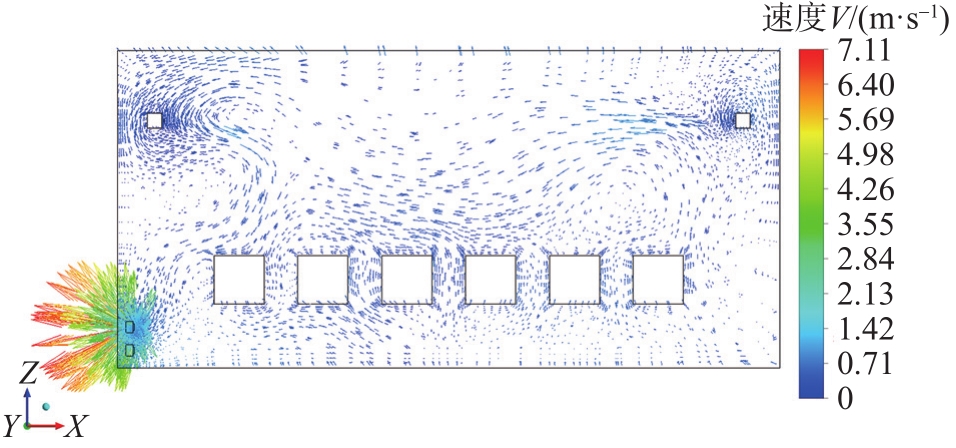
    Figure 12.  Section (passing the air outlet) velocity distribution vector diagram when Y=58.4m

    观察矢量图8显示的发热阀体周围空气流动情况,可以看出在阀体表面附近有明显的气流上升现象;中部第2、3、4、5阀体上表面存在气流漩涡,此处下行低温送风气流与上升高温气流相遇,旋涡中心气流速度接近于0,这也导致了中部阀体温度高于两侧阀体。图9显示送风口平均射程大约在18 m左右,相对于90.5 m的超长空间来说,射程相对较短。除送风口处速度,阀厅空气速度整体在1.5 m/s以下,重新设定标尺范围,厅内空气速度分布云图如图10所示。

    图10显示,阀厅内存在静风区,右侧下行送风气流可到达右侧两阀体中间,带走阀体热量;而左侧下行送风气流受到热浮升气流的阻挡,难以下送到阀体周围,且由于左下角回风口的设置,左侧部分气流直接绕过最左侧阀体被吸入回风口,导致左侧第1、2个阀体处空气温度较高(如图7所示)。

    回风口处最高流速为7.10 m/s,图12显示的空气流动规律与图8所示一致,均显示阀体周围有明显的热浮升气流。与图8不同,Y=58.4 m截面处,左侧下行气流到达了最左侧阀体顶部,而右侧送风气流掠过右侧两阀体,在中部两阀体上部与热浮升气流相遇,这一气流分布情况解释了图5所示前后两排阀体温度分布情况的差别。

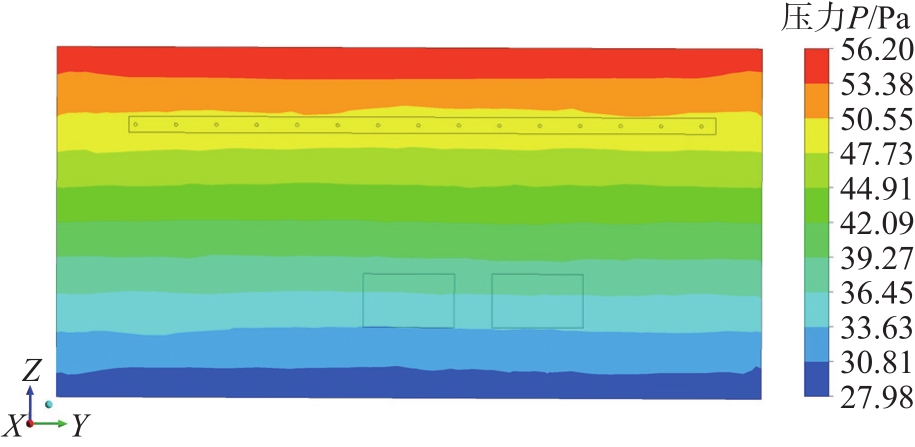
  • 阀厅内平均压力为42.18 Pa,由于模拟假设条件为房间密闭无泄漏,因此实际情况中,压力值肯定比模拟值小很多。阀厅内压力分布情况如图13图14所示。

    Figure 13.  Section pressure distribution cloud diagram when X=34 m

    Figure 14.  Section pressure distribution cloud diagram when Y=52 m

    以上压力分布云图显示,Z轴方向存在明显的压力梯度,沿Z轴向上,压力逐渐增大。按照理想气体方程,稳态后厅内空气压力与温度成正比,根据2.1节温度场分布情况,温度也存在上下分层的现象,沿Z轴向上,厅内空气温度升高,因此压力分布存在明显的分层现象。

  • 球形喷口水平侧送,百叶回风情况下,阀厅室内空气温度30.30 ℃,满足常规阀厅温度不超过45 ℃的设计要求。阀体表面平均温度为52.91 ℃,阀体表面温度不均匀,存在局部高温,最高温度可达62.93 ℃,这是由于阀厅室内气流组织在局部区域不理想。水平送风使得到达阀体表面的气流速度较小,区域气流速度几乎为0,且在各阀体之间存在明显的热浮升气流,向下的送风气流与热浮升气流相遇后在阀体表面产生漩涡,使得阀体局部区域的热量不能及时排除,最终导致这些表面局部温度较高,可能会对阀体的正常运行造成安全隐患。

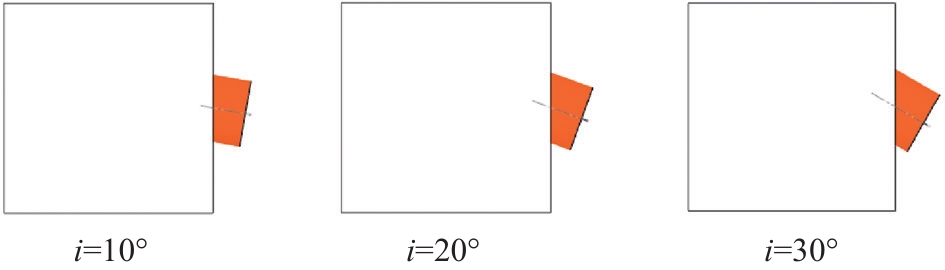
  • 上述球形喷口水平送风模拟结果显示阀体表面温度以下考虑更改球形喷口送风角度来改善阀厅内部气流组织,送风温度和送风量不变,同表2所示一致。通过修改物理模型中圆柱体送风口与XY平面的倾角来更改送风角度,考虑倾角i=10°、i=20°、i=30°三种情况,修改后模型局部放大图如图15所示。

    Figure 15.  Model diagram of air supply outlets with different air supply angles

  • 不同送风角度下,阀厅内空气温度分布情况如图16图19所示。

    Figure 16.  Section temperature distribution cloud map when i=10°, Y=52 m

    Figure 17.  Section temperature distribution cloud map when i=20°, Y=52 m

    Figure 18.  Section temperature distribution cloud map when i=30°, Y=52 m

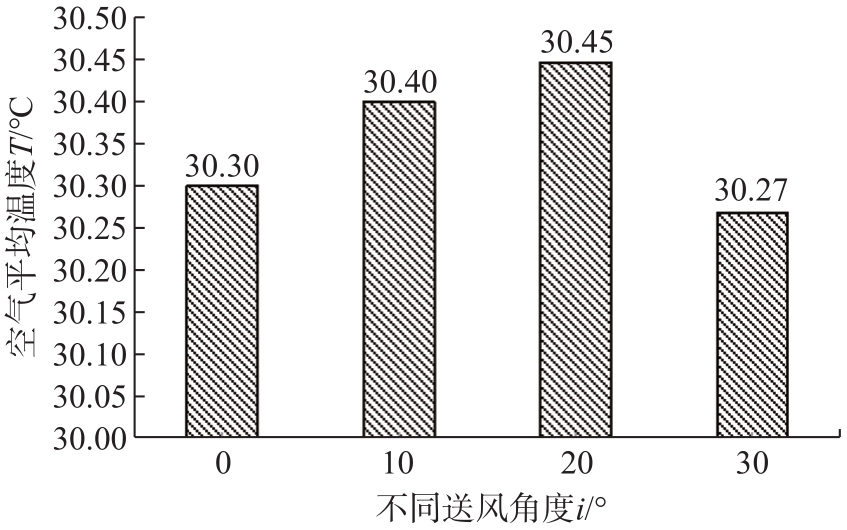
    Figure 19.  Average air temperature in valve hall

    对比以上温度分布云图,除i=20°送风工况,i=10°、30°工况时截面 (Y=52 m) 最高温度均小于32 ℃。当送风倾角i=10°时,X轴右侧送风气流很难到达阀体表面冷却阀体,导致阀厅右侧空气温度偏高。当送风倾角i=20°时,两侧送风气流将阀体周围的热浮升气流挤到中部,导致中部两阀体周围空气温度较高。当送风倾角i=30°时,此截面空气温度最低,此时低温送风气流与右侧三阀体充分对流,带走热量,且此送风角度下射流距离最远,各阀体下部空气温度较低。

    不同送风角度下,室内平均空气温度差别不大,仅有0.1 ℃左右的差别,其中,喷口送风角度为30°时,阀厅内空气温度最低。

    不同送风角度下,阀厅内阀体表面空气温度分布情况如图20图23所示。

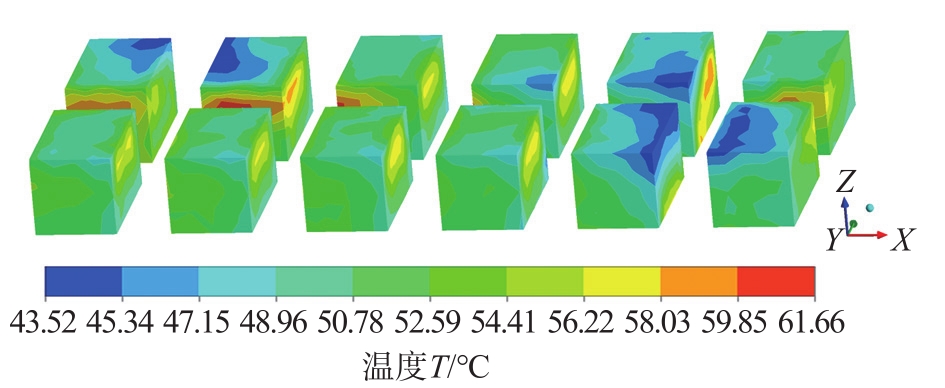
    Figure 20.  Valve body surface temperature distribution cloud map when i=10°

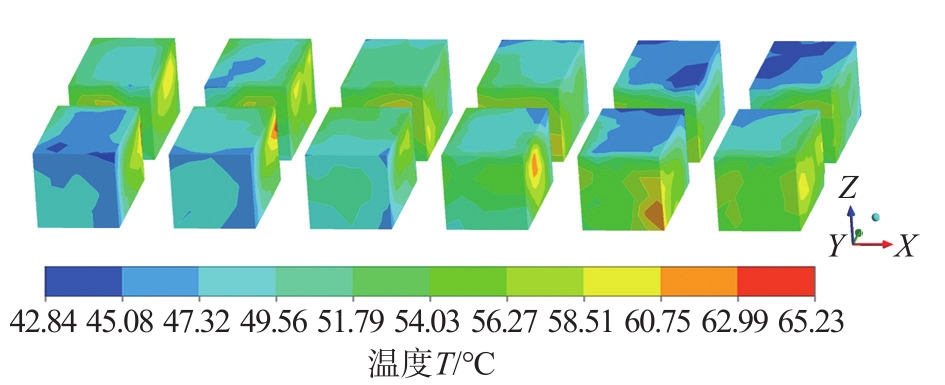
    Figure 21.  Valve body surface temperature distribution cloud map when i=20°,

    Figure 22.  Valve body surface temperature distribution cloud map when i=30°

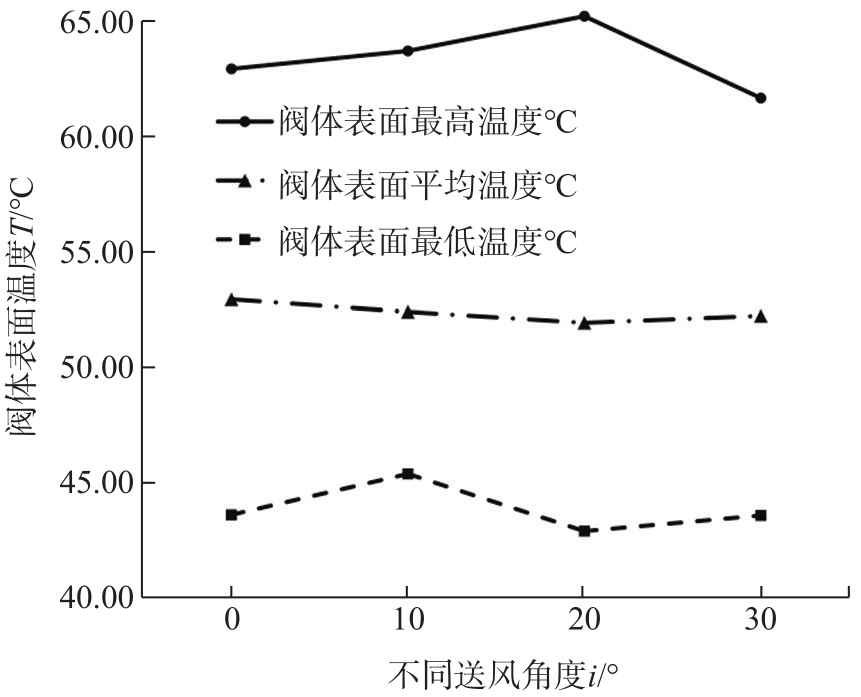
    Figure 23.  The minimum temperature, average temperature and maximum temperature of the valve body surface

    图20图23可知,当送风角度逐渐增大时,阀体表面平均温度逐渐降低,在i=20°,阀体表面平均温度最低为51.90 ℃,但是此送风角度下阀体表面温度分布很不均匀,局部地方显著高温,阀体表面最高温度高达65.22 ℃;当送风角度增大至30°时,阀体表面平均温度升高一点为52.20 ℃,此时阀体表面最高温度为61.66 ℃,与i=20°时的阀体最高温度相差3.5 ℃。

    送风角度会显著影响阀体表面温度。相比较而言,当送风角度为30°时,由于阀体表面最低温度、最高温度、平均温度均处于较低值,此种送风角度下阀体表面温度分布更为均匀。

  • 不同送风角度下,阀厅内气流速度分布情况如图24图26所示。

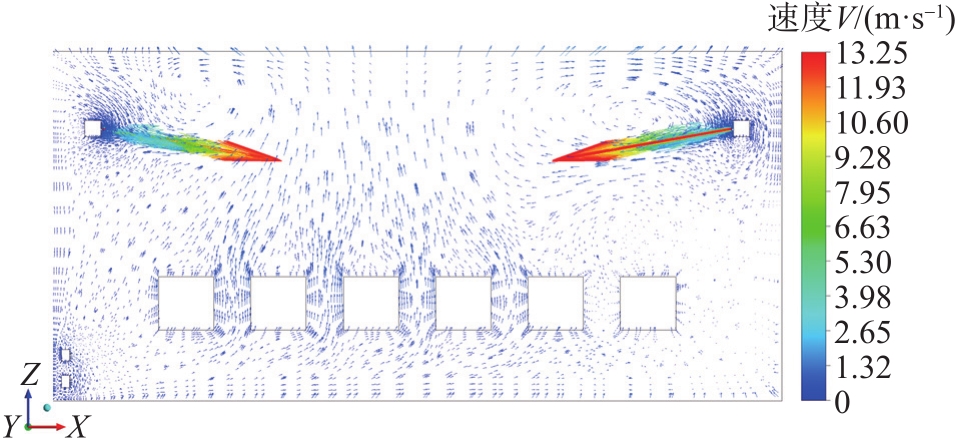
    Figure 24.  Section velocity distribution vector diagram when i=10°, Y=44.75 m

    Figure 25.  Section velocity distribution vector diagram when i=20°, Y=44.75 m

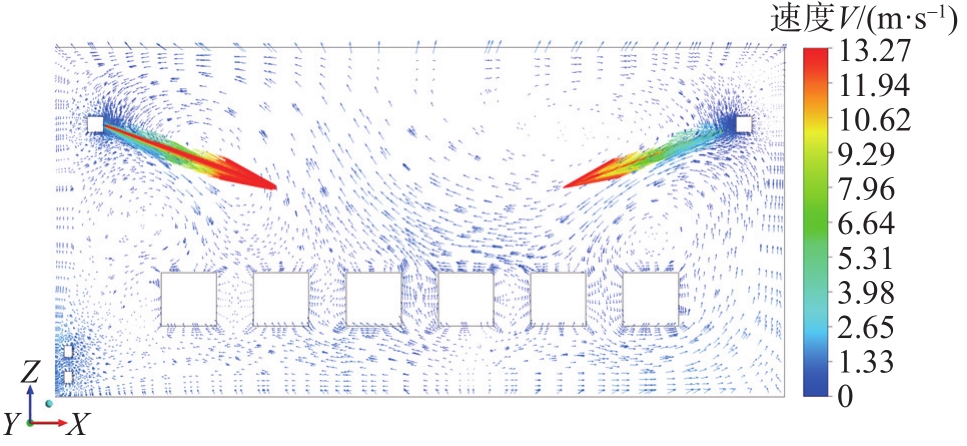
    Figure 26.  Section velocity distribution vector diagram when i=30°, Y=44.75m

    观察以上速度分布矢量图,不同送风角度下,送风口最大速度均在13.2 m/s左右,阀体周围也都存在热浮升气流,与水平送风情况不同,当倾角稍微向下时,阀体底部的热浮升气流速度较大,可有效带走阀体底部热量,阀体上表面气流漩涡情况也有所改善。i=10°时,下行送风气流与热浮升气流在阀体上部相遇,最右侧阀体区域出现静风区;i=20°时,阀厅内空气整体流速较大,左右两侧送风气流均到达左右侧阀体顶部,但是此时中部4阀体周围存在气流漩涡,会导致阀体局部高温;i=30°时,阀体周围空气流速较大,右侧送风气流可到达阀体顶部并与右侧阀体发生充分对流,但是左侧送风气流与热浮升气流在阀体上部空间相遇,导致最左侧阀体处空气温度较高。由此可见,送风角度不同可显著影响阀厅内速度场分布,从而影响阀厅内空气温度分布情况。不同送风角度下,阀厅内气流分布都不均匀。

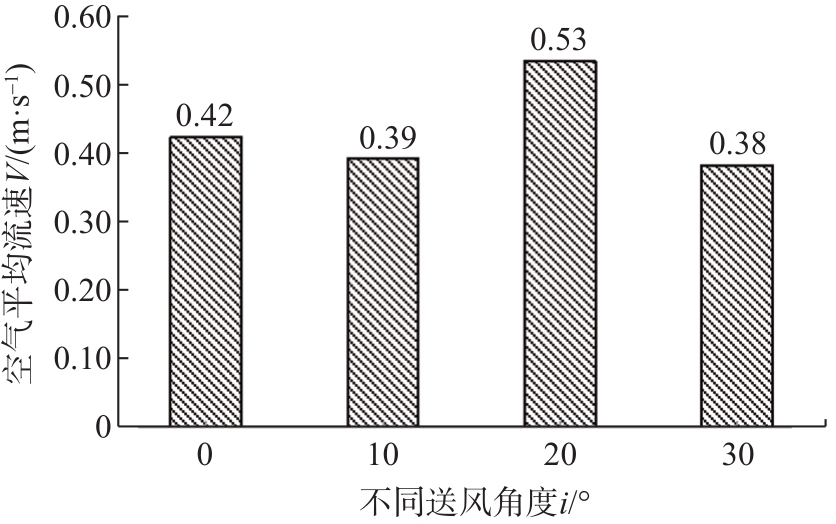
    不同送风角度下,阀厅内空气平均速度如图27所示。

    Figure 27.  Average speed of air in valve hall

    如图所示,当送风角度为20°时,阀厅内空气平均速度最大,其余送风角度下阀厅平均气流速度相差不大。

  • 通过对特高压柔直阀厅球形喷口送风情况进行仿真模拟分析,得出以下结论:

    1)球形喷口水平侧送,百叶回风情况下,阀厅室内气流组织在局部区域不理想。阀厅室内空气平均温度30.30 ℃,满足阀厅温度不超过45 ℃的设计要求。阀体表面平均温度为52.91 ℃,阀体表面温度不均匀,存在局部高温,最高温度可达62.93 ℃。

    2)夏季球形喷口送风时,最优喷口倾角i=30°。当喷口送风角度不同时,阀厅内温度场、速度场分布情况发生变化。送风角度为30°时,阀体表面平均温度也较低,此时阀体表面温度分布较其他送风工况均匀,阀体表面最高温度是四种送风情况下最低的。

    3)送风角度对于厅内空气平均温度、平均风速影响较小,各送风角度下室内空气平均温度差值在0.1 ℃左右,平均风速差值在0.1 m/s左右,其中i=30°时,室内空气平均温度最低,i=20°时,室内空气平均流速最大。

Reference (15)

Catalog

    /

    DownLoad:  Full-Size Img  PowerPoint
    Return
    Return