• Peer Review
  • Non-profit
  • Global Open Access
  • Green Channel for Rising Stars
Volume 11 Issue 1
Jan.  2024
Turn off MathJax
Article Contents

SUN Pengjie, HE Fei, CHEN Zhenghong, et al. Refined assessment of solar energy resources and calculation of technical exploitable capacity considering terrain influence [J]. Southern energy construction, 2024, 11(1): 10-18. DOI: 10.16516/j.ceec.2024.1.02 doi:  10.16516/j.ceec.2024.1.02
Citation: SUN Pengjie, HE Fei, CHEN Zhenghong, et al. Refined assessment of solar energy resources and calculation of technical exploitable capacity considering terrain influence [J]. Southern energy construction, 2024, 11(1): 10-18. DOI: 10.16516/j.ceec.2024.1.02 doi:  10.16516/j.ceec.2024.1.02

Refined Assessment of Solar Energy Resources and Calculation of Technical Exploitable Capacity Considering Terrain Influence

doi: 10.16516/j.ceec.2024.1.02
  • Received Date: 2023-01-03
  • Rev Recd Date: 2023-03-12
  • Available Online: 2024-01-17
  • Publish Date: 2024-01-10
  •   Introduction  To achieve "carbon peaking and carbon neutrality" goals, the total installed capacity of wind and photovoltaic power generation in China will have to be increased by more than twice the current level by 2030. The international community has reached a consensus on developing solar energy resources and other kinds of renewable and clean energy vigorously. In this article, taking Fang County in Hubei Province as an example, a refined evaluation of solar energy resources is conducted and the technical exploitable capacity is calculated by combining reanalysis data and terrain data to provide data support for the appropriate development and utilization of solar energy resources.   Method  The reanalysis data of nearby ERA5 were corrected and a radiation grid product with an accuracy of 0.1°×0.1° was produced based on the radiation observation data obtained from 2012 to 2020 in one radiation observation station (Station A) located in the county. A geographic information-based radiation model was established by using GIS technology and considering factors such as slope, aspect, altitude, and their impact on radiation. Based on Landsat TM/ETM/OLI remote sensing image data and incorporating land use type data, the limitations of photovoltaic development and the availability of different land types were discussed.   Result  The built model can satisfactorily reflect the actual radiation situation. The model simulation results are compared with the actual observation data in two other radiation observation stations (Station B and C) in the region and the results are that, considering the overall situation throughout the year, the annual average relative errors of Station B and Sstation C is 5.7% and 3.4%, respectively, and from the perspective of the monthly radiation, the relative error of Station B is between 2% (January) and 14.1% (August), and that of Station C is between 0.1% (February) and 15.4% (June).   Conclusion  Based on the simulation results, it is clear how solar energy resources are distributed in Fangxian County. Spatially, there are more resources in the windy region of the central valley and fewer resources in the high-altitude mountainous areas in the south and north, with an annual total radiation of 4.00~4.13 GJ/m2. It is calculated that the exploitable area for photovoltaic power generation in Fangxian County is 60.7 km2, and the technological development capacity is 4.501 GW.
  • [1] 朱艳红. 服务分布式光伏发电 推动清洁能源发展 [J]. 农电管理, 2016(1): 27.

    ZHU Y H. Serving distributed photovoltaic power generation and promoting the development of clean energy [J]. Rural power management, 2016(1): 27.
    [2] 王新鹏. 基于绿色能源开发的太阳能光热发电产业研究 [J]. 电力系统装备, 2018(8): 65-66.

    WANG X P. Research on solar thermal power generation industry based on green energy development [J]. Electric power system equipment, 2018(8): 65-66.
    [3] 韩文政. 中电投和田20兆瓦光伏并网发电项目评价研究 [D]. 北京: 北京化工大学, 2015. DOI: 10.7666/d.Y2976691.

    HAN W Z. China power investment corporation Wada 20 MW grid-connected PV project evaluation study [D]. Beijing: Beijing University of Chemical Technology, 2015. DOI: 10.7666/d.Y2976691.
    [4] 吕清泉, 张珍珍, 马彦宏, 等. 区域光伏发电出力特性分析研究 [J]. 发电技术, 2022, 43(3): 413-420. DOI:  10.12096/j.2096-4528.pgt.2106.

    LÜ Q Q, ZHANG Z Z, MA Y H, et al. Analysis and research on output characteristics of regional photovoltaic power generation [J]. Power generation technology, 2022, 43(3): 413-420. DOI:  10.12096/j.2096-4528.pgt.2106.
    [5] 胡祥铮. 基于LCA和LCC的不同发电方式可持续性评价及案例研究 [D]. 沈阳: 东北大学, 2019.

    HU X Z. Sustainability evaluation and case study of different power generation modes based on LCA and LCC [D]. Shenyang: Northeastern University, 2019.
    [6] 徐丽娜, 申彦波, 李忠, 等. FY-4A SSI产品在辐射观测稀疏位置的偏差订正方案 [J]. 高原气象, 2022, 41(4): 1051-1061. DOI:  10.7522/j.issn.1000-0534.2021.00069.

    XU L N, SHEN Y B, LI Z, et al. Deviation correction scheme of FY-4A SSI product in the position of sparse radiation observation [J]. Plateau meteorology, 2022, 41(4): 1051-1061. DOI:  10.7522/j.issn.1000-0534.2021.00069.
    [7] 张俊兵, 沈润平, 师春香, 等. 中国大陆地区ERA5下行短波辐射数据适用性评估与对比 [J]. 地球信息科学学报, 2021, 23(12): 2261-2274. DOI:  10.12082/dqxxkx.2021.180357.

    ZHANG J B, SHEN R P, SHI C X, et al. Evaluation and comparison of downward solar radiation from new generation atmospheric reanalysis ERA5 across mainland China [J]. Journal of geo-information science, 2021, 23(12): 2261-2274. DOI:  10.12082/dqxxkx.2021.180357.
    [8] 张星星, 吕宁, 姚凌, 等. ECMWF地表太阳辐射数据在我国的误差及成因分析 [J]. 地球信息科学学报, 2018, 20(2): 254-267. DOI:  10.12082/dqxxkx.2018.170381.

    ZHANG X X, LÜ N, YAO L, et al. Error analysis of ECMWF surface solar radiation data in China [J]. Journal of geo-information science, 2018, 20(2): 254-267. DOI:  10.12082/dqxxkx.2018.170381.
    [9] 渠鸿宇, 黄彬, 赵伟, 等. HRCLDAS-V1.0和ERA5海面风场对比评估分析 [J]. 热带气象学报, 2022, 38(4): 569-579. DOI:  10.16032/j.issn.1004-4965.2022.051.

    QU H Y, HUANG B, ZHAO W, et al. Comparison and evaluation of HRCLDAS-V1.0 and ERA5 sea-surface wind fields [J]. Journal of tropical meteorology, 2022, 38(4): 569-579. DOI:  10.16032/j.issn.1004-4965.2022.051.
    [10] 王雪洁, 施国萍, 周子钦, 等. 基于随机森林算法对ERA5太阳辐射产品的订正 [J]. 自然资源遥感, 2022, 34(2): 105-111. DOI:  10.6046/zrzyyg.2021151.

    WANG X J, SHI G P, ZHOU Z Q, et al. Revision of solar radiation product ERA5 based on random forest algorithm [J]. Remote sensing for natural resources, 2022, 34(2): 105-111. DOI:  10.6046/zrzyyg.2021151.
    [11] 曾燕, 邱新法, 潘敖大, 等. 地形对黄河流域太阳辐射影响的分析研究 [J]. 地球科学进展, 2008, 23(11): 1185-119. DOI:  10.3321/j.issn:1001-8166.2008.11.009.

    ZENG Y, QIU X F, PAN A D, et al. Distributed modeling of global solar radiation over rugged terrain of the Yellow River basin [J]. Advances in earth science, 2008, 23(11): 1185-119. DOI:  10.3321/j.issn:1001-8166.2008.11.009.
    [12] 翟雯. 探析不同地形下的光伏场区总平面布置 [J/OL]. (2021-04-23) [2023-07-25]. https://d.wanfangdata.com.cn/periodical/changjjs202035047.

    ZHAI W. The general layout of photovoltaic field under different topography [J/OL]. (2021-04-23)[2023-07-25]. https://d.wanfangdata.com.cn/periodical/changjjs202035047.
    [13] 吉广健, 汪兴兴, 王平, 等. 不同地形场址光伏系统应用的现状分析 [J]. 电源技术, 2018, 42(6): 918-921. DOI:  10.3969/j.issn.1002-087X.2018.06.050.

    JI G J, WANG X X, WANG P, et al. Analysis of the application in different terrain site of photovoltaic system [J]. Chinese journal of power sources, 2018, 42(6): 918-921. DOI:  10.3969/j.issn.1002-087X.2018.06.050.
    [14] 王志春, 张新龙, 苑俐, 等. 内蒙古赤峰市太阳能资源评估与开发潜力分析 [J]. 沙漠与绿洲气象, 2021, 15(2): 106-111. DOI:  10.12057/j.issn.1002-0799.2021.02.013.

    WANG Z C, ZHANG X L, YUAN L, et al. Anlysis of assessment and exploitation potential of solar energy resource in Chifeng City of Inner Mongolia [J]. Desert and oasis meteorology, 2021, 15(2): 106-111. DOI:  10.12057/j.issn.1002-0799.2021.02.013.
    [15] 梁玉莲, 申彦波, 白龙, 等. 华南地区太阳能资源评估与开发潜力 [J]. 应用气象学报, 2017, 28(4): 481-492. DOI:  10.11898/1001-7313.20170409.

    LIANG Y L, SHEN Y B, BAI L, et al. Assessment of solar energy resource and its exploitation potential in south China [J]. Journal of applied meteorological science, 2017, 28(4): 481-492. DOI:  10.11898/1001-7313.20170409.
    [16] 李柯, 何凡能. 中国陆地太阳能资源开发潜力区域分析 [J]. 地理科学进展, 2010, 29(9): 1049-1054. DOI:  10.11820/dlkxjz.2010.09.004.

    LI K, HE F N. Regional analysis of the development potential of terrestrial solar energy resources in China [J]. Advances in geographical science, 2010, 29(9): 1049-1054. DOI:  10.11820/dlkxjz.2010.09.004.
    [17] 周少科, 段杰, 央金白姆. 山南市可用太阳能资源开发潜力及分布研究 [J]. 河南农业, 2017(33): 51-53. DOI:  10.15904/j.cnki.hnny.2017.35.032.

    ZHOU S K, DUAN J, YANGJIN B M. Study on development potential and distribution of available solar energy resources in Shannan City [J]. Henan agriculture, 2017(33): 51-53. DOI:  10.15904/j.cnki.hnny.2017.35.032.
    [18] 刘可群, 陈正洪, 夏智宏. 湖北省太阳能资源时空分布特征及区划研究 [J]. 华中农业大学学报, 2007, 26(6): 888-893. DOI:  10.3321/j.issn:1000-2421.2007.06.030.

    LIU K Q, CHEN Z H, XIA Z H. The characteristic analysis and division research of solar energy resources in Hubei Province [J]. Journal of Huazhong Agricultural University, 2007, 26(6): 888-893. DOI:  10.3321/j.issn:1000-2421.2007.06.030.
    [19] 国家市场监督管理总局, 国家标准化管理委员会. 太阳能资源评估方法: GB/T 37526—2019 [S]. 北京: 中国标准出版社, 2019.

    State Administration for Market Regulation, Standardization Administration of the People's Republic of China. Assessment method for solar energy resource: GB/T 37526—2019 [S]. Beijing: Standards Press of China, 2019.
    [20] 王炳忠, 申彦波. 自然环境条件对太阳能资源计算影响的再思考 [J]. 应用气象学报, 2012, 23(4): 505-512. DOI:  10.3969/j.issn.1001-7313.2012.04.015.

    WANG B Z, SHEN Y B. Reconsideration about effects of natural environmental conditions on the calculation of solar energy resources in China [J]. Journal of applied meteorological science, 2012, 23(4): 505-512. DOI:  10.3969/j.issn.1001-7313.2012.04.015.
    [21] 中国可再生能源发展战略研究项目组. 中国可再生能源发展战略研究丛书——太阳能卷 [M]. 北京: 中国电力出版社, 2008.

    China Renewable Energy Development Strategy Research Project Team. China renewable energy development strategy research series: solar energy [M]. Beijing: China electric power press, 2008.
  • 通讯作者: 陈斌, bchen63@163.com
    • 1. 

      沈阳化工大学材料科学与工程学院 沈阳 110142

    1. 本站搜索
    2. 百度学术搜索
    3. 万方数据库搜索
    4. CNKI搜索

Figures(5)  / Tables(5)

Article Metrics

Article views(289) PDF downloads(282) Cited by()

Related

Refined Assessment of Solar Energy Resources and Calculation of Technical Exploitable Capacity Considering Terrain Influence

doi: 10.16516/j.ceec.2024.1.02

Abstract:   Introduction  To achieve "carbon peaking and carbon neutrality" goals, the total installed capacity of wind and photovoltaic power generation in China will have to be increased by more than twice the current level by 2030. The international community has reached a consensus on developing solar energy resources and other kinds of renewable and clean energy vigorously. In this article, taking Fang County in Hubei Province as an example, a refined evaluation of solar energy resources is conducted and the technical exploitable capacity is calculated by combining reanalysis data and terrain data to provide data support for the appropriate development and utilization of solar energy resources.   Method  The reanalysis data of nearby ERA5 were corrected and a radiation grid product with an accuracy of 0.1°×0.1° was produced based on the radiation observation data obtained from 2012 to 2020 in one radiation observation station (Station A) located in the county. A geographic information-based radiation model was established by using GIS technology and considering factors such as slope, aspect, altitude, and their impact on radiation. Based on Landsat TM/ETM/OLI remote sensing image data and incorporating land use type data, the limitations of photovoltaic development and the availability of different land types were discussed.   Result  The built model can satisfactorily reflect the actual radiation situation. The model simulation results are compared with the actual observation data in two other radiation observation stations (Station B and C) in the region and the results are that, considering the overall situation throughout the year, the annual average relative errors of Station B and Sstation C is 5.7% and 3.4%, respectively, and from the perspective of the monthly radiation, the relative error of Station B is between 2% (January) and 14.1% (August), and that of Station C is between 0.1% (February) and 15.4% (June).   Conclusion  Based on the simulation results, it is clear how solar energy resources are distributed in Fangxian County. Spatially, there are more resources in the windy region of the central valley and fewer resources in the high-altitude mountainous areas in the south and north, with an annual total radiation of 4.00~4.13 GJ/m2. It is calculated that the exploitable area for photovoltaic power generation in Fangxian County is 60.7 km2, and the technological development capacity is 4.501 GW.

SUN Pengjie, HE Fei, CHEN Zhenghong, et al. Refined assessment of solar energy resources and calculation of technical exploitable capacity considering terrain influence [J]. Southern energy construction, 2024, 11(1): 10-18. DOI: 10.16516/j.ceec.2024.1.02 doi:  10.16516/j.ceec.2024.1.02
Citation: SUN Pengjie, HE Fei, CHEN Zhenghong, et al. Refined assessment of solar energy resources and calculation of technical exploitable capacity considering terrain influence [J]. Southern energy construction, 2024, 11(1): 10-18. DOI: 10.16516/j.ceec.2024.1.02 doi:  10.16516/j.ceec.2024.1.02
    • 当前,随着常规能源的日益紧张、全球气候变化和环境恶化压力的逐渐增大,大力开发包括太阳能资源在内的可再生清洁能源已成为国际社会的共识[1-3]。特别是我国提出的“碳达峰、碳中和”目标,意味着到2030年,我国风电、光伏发电总装机要在现有基础上增加2倍以上。有专家预计,2025年,我国光伏发电将逐步成为主力能源。国家层面上,国家能源局于2021年6月发布《关于报送整县(市、区)屋顶分布式光伏开发试点方案的通知》,通知指出:开展整县(市、区)屋顶分布式光伏建设,有利于整合资源实现集约开发,有利于消减电力尖峰负荷,有利于节约优化配电网投资,有利于引导居民绿色能源消费,是实现“碳达峰、碳中和”与乡村振兴两大国家战略的重要措施。

      进行光伏发电开发的基础,首先要了解当地的太阳能资源禀赋情况[4-5],待开发区域的太阳能资源总储量为多少,理论装机和发电量为多少,资源分布如何,进行太阳能资源科学评估非常有必要。湖北省境内分布着大量气象观测站,为研究某一气候变化提供实测的资料和数据,但湖北省辐射观测站却很少,仅有武汉和宜昌一级辐射观测站,能观测太阳总辐射、直接辐射、散射辐射资料,另外有4个三级辐射站(荆州、随州、南漳、孝感),其台站密度远少于普通气象观测站的密度,这就导致湖北省大部分区域太阳辐射资料的缺乏,无法对湖北省太阳辐射的空间分布特征展开研究[6]

      ERA5太阳辐射数据是具有较高时空分辨率的再分析产品,该数据在区域气候评估、农业以及太阳能资源等方面发挥了重要作用[7-9]。利用该套资料成功解决辐射观测站数量少、分布密度低的困难。但相关学者通过对比发现,ERA5辐射数据高于地面观测数据,存在高估现象[10]。特别对山区而言,分辨率约为10 km的ERA5辐射数据不能反映地形(坡向、坡度、海拔)对辐射的影响[11]

      在太阳能开发潜力(技术可开发量)计算方面,多数学者采用的是将太阳年总辐射进行等级划分,在此基础上,对下垫面地形进行划分,针对不同类型地形赋予不同的开发比例[12-13]。王志春等[14]从开发建设成本、耕地及生态环境保护方面分析,计算了不同土地开发光伏占比。梁玉莲等[15]结合地形数据和土地覆盖数据,分别以90 m×90 m和1 km×1 km的分辨率对华南地区太阳能资源的开发适宜性进行区划和可利用潜力进行分析。李柯等[16]从资源丰富度、稳定度和保障度3个方面,利用多指标评分法对中国陆地太阳能资源开发潜力进行了综合评价和分析。周少科等[17]利用西藏山南市气象观测站和NASA卫星数据对山南市的太阳能资源就辐射总量、辐射分布和转换电能潜能进行了分析。

      本研究首先利用研究区域房县境内已有的辐射观测资料对ERA5格点数据进行修正,得到辐射格点数据。进一步结合房县市的海拔高度、坡度和坡向等地理信息,建立基于地形变化的精细化辐射方程,获取分辨率为25 m的太阳能总辐射资源,对区域太阳能资源进行客观评价。最后引入卫星遥感观测的土地利用类型数据,针对不同土地类型,计算房县全域太阳能技术可开发量。

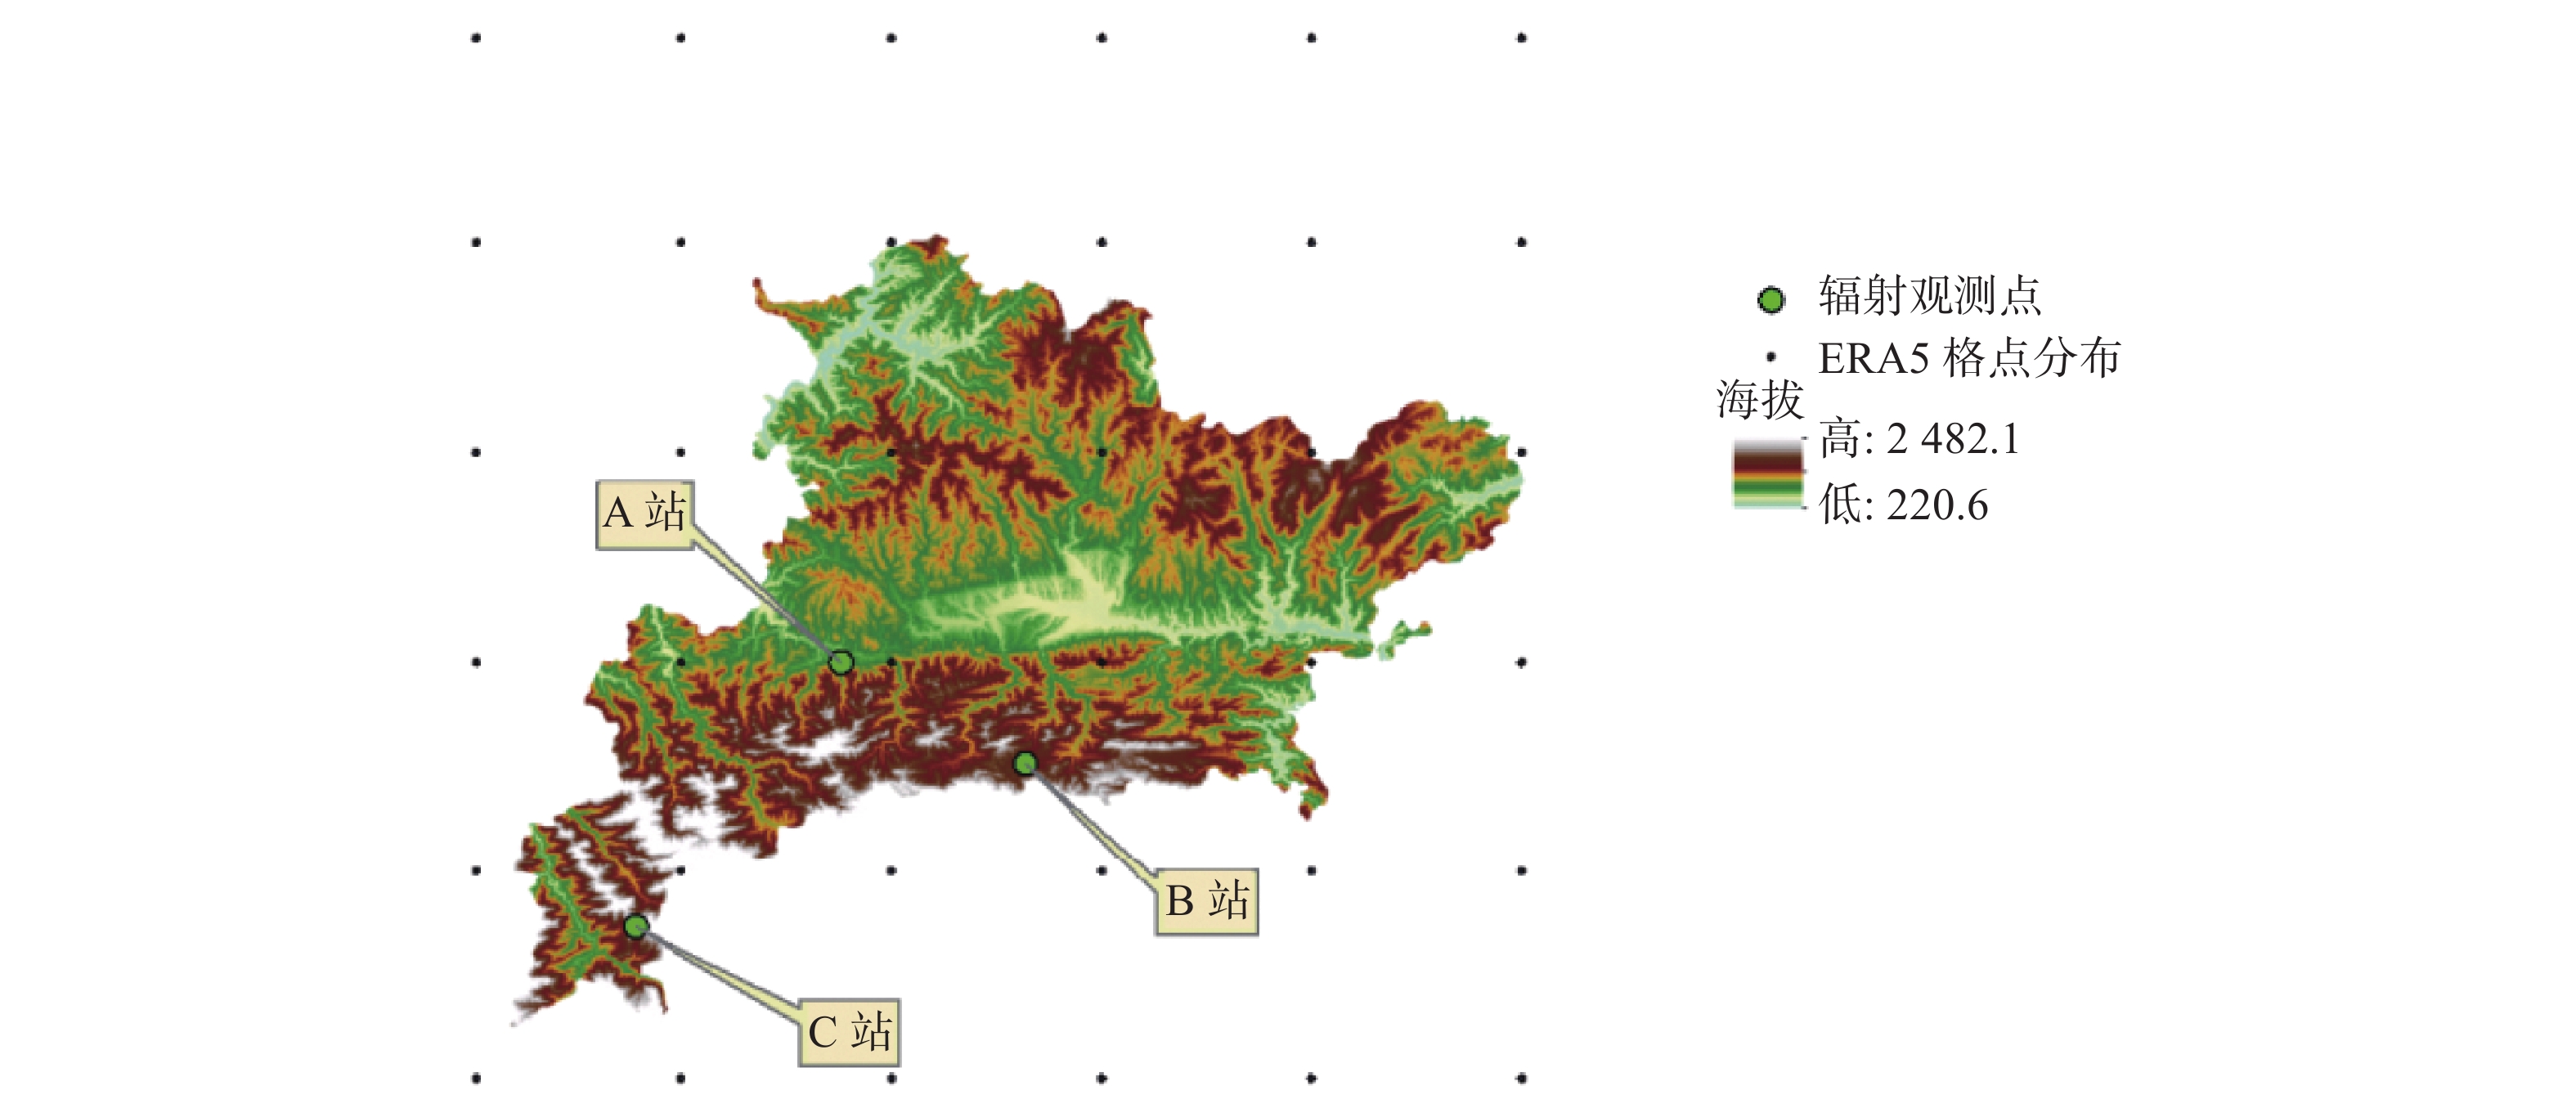
    • 房县市位于鄂西北,因“纵横千里,山林四塞,其固高陵,有如房室”而得名。大巴山脉和武当山脉在此交汇,形成了著名的青峰断裂带和西高东低、南陡北缓的地形地貌,中为河谷平坝,最高海拔2 485.6 m,最低海拔180 m,高低悬殊。基于气候学计算与分析,房县位于湖北省“一级可利用区”(年总辐射在4.6~5.4 GJ/m2之间),属于湖北省太阳能资源较丰富的地区[18]。全市有3个太阳辐射观测站,分布如图1所示。同时,ERA5太阳辐射数据分布如图1所示。

      Figure 1.  Topography and distribution schematic of solar radiation stations in the assessment area

    • 辐射观测资料:辐射观测数据来源于房县境内A、B、C 3个辐射观测站观测资料。资料时段从2012.01~2020.12,共9年观测资料。

      辐射再分析格点资料:本研究采用的格点辐射资料来自欧洲中心ERA5再分析数据,ERA5是ECMWF对全球气候的第5代大气再分析,再分析将模型数据与来自世界各地的观测数据结合起来,形成一个全球完整的、一致的数据集。水平分辨率为0.1°×0.1°,资料范围为2000.01~2020.12,共21 a资料。

      土地利用类型资料:基于Landsat TM/ETM/OLI遥感影像资料,采用遥感信息提取方法,获取覆盖房县范围,水平分辨率为30 m的8类(农田、森林、草地、灌木丛、湿地、水体、建设用地、荒地)土地覆盖分类数据。

      地理信息资料:基于湖北省1∶250 000省界、水系、数字高程模型数据(DEM),利用Arcgis软件三维空间分析功能提取得到房县海拔、坡度、坡向和经纬度数据。

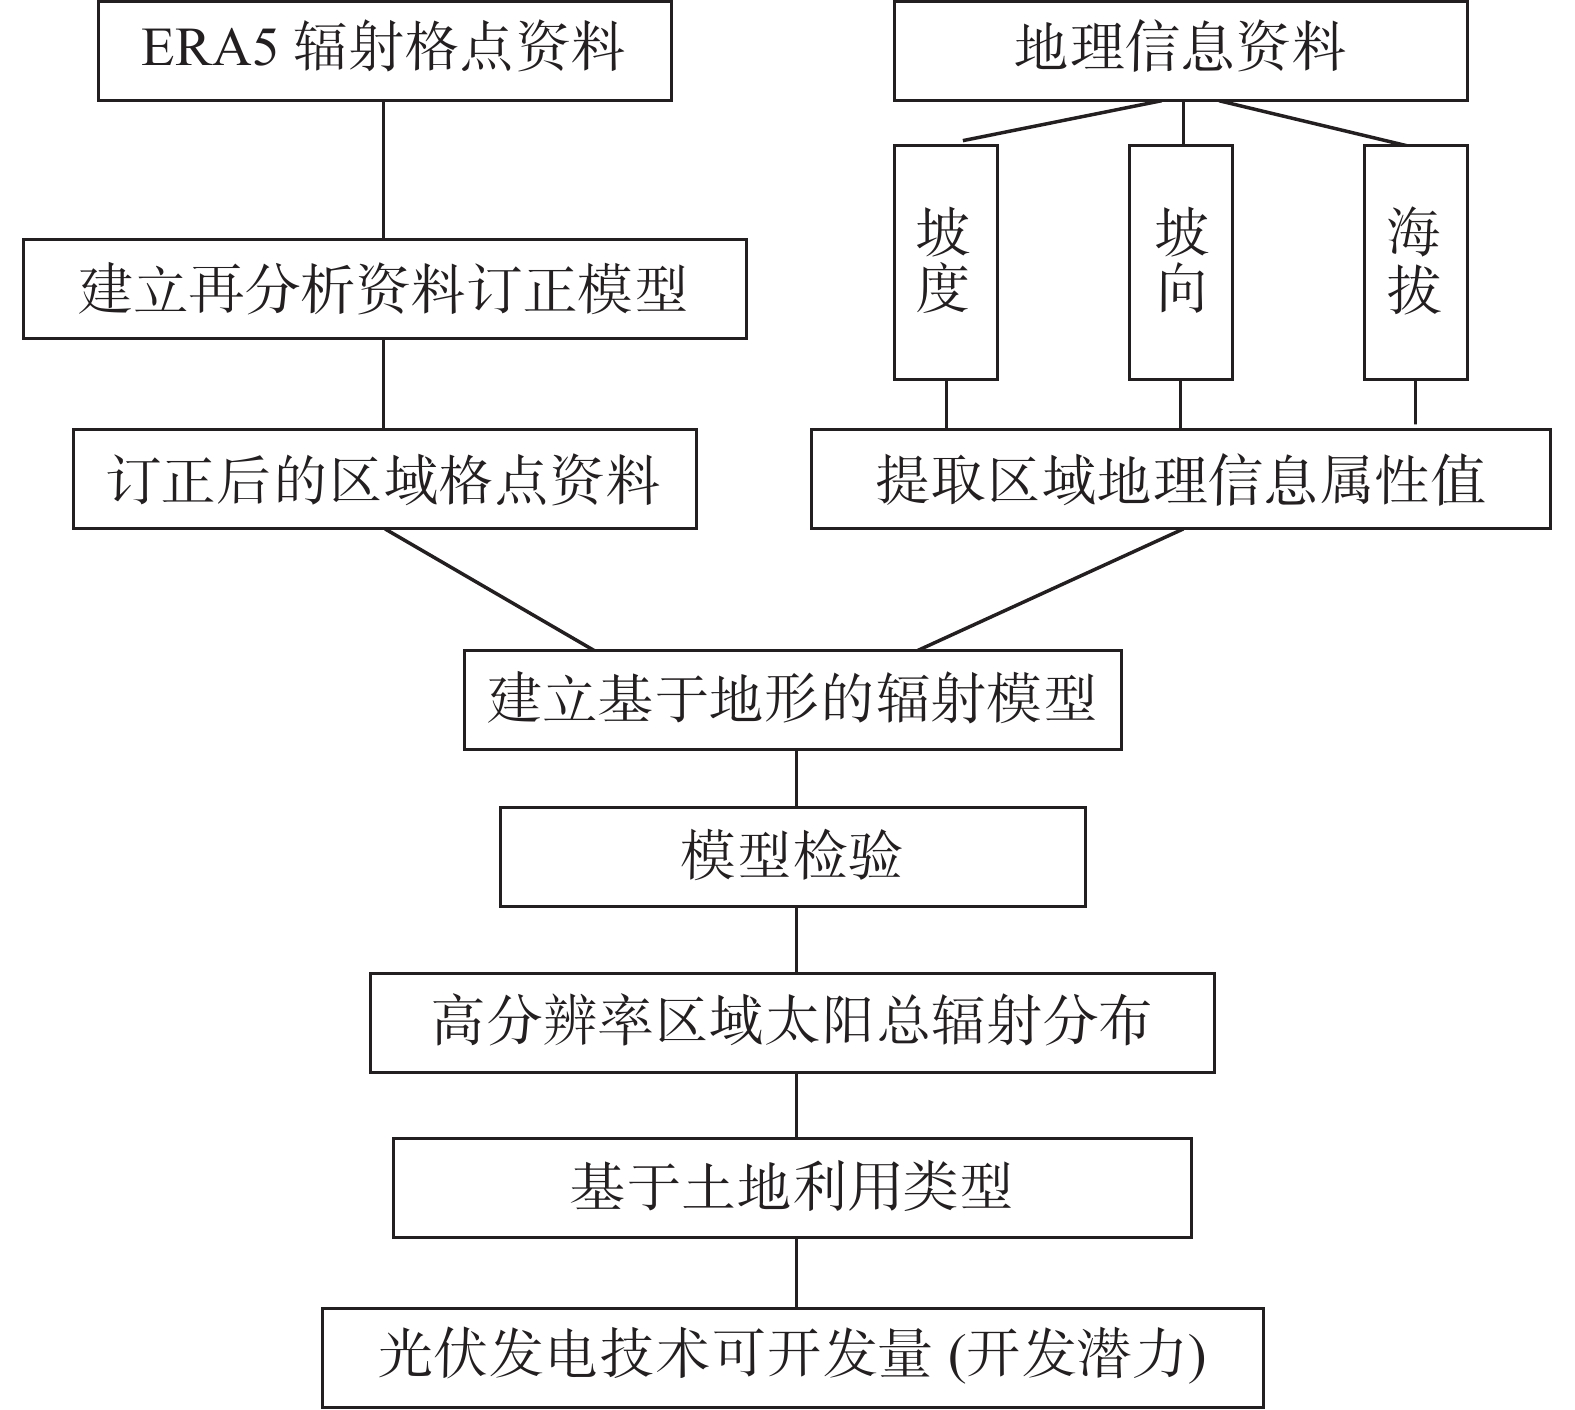
    • 本研究的总体思路是利用辐射气象站的实际观测资料检验观测同期ERA5的辐射数据精度,建立订正模型后对房县区域的ERA5辐射数据进行订正,进一步结合房县市的经纬度、海拔高度、坡度和坡向等地理信息,建立基于地形变化的精细化辐射方程,得到分辨率为25 m的长序列太阳能总辐射资源,对房县市的太阳能资源进行评估。在太阳能资源图谱的基础上,基于土地利用类型资料,剔除不能开发和限制开发的区域,获取乡镇级的光伏技术开发量。研究所用方法如图2所示。

      Figure 2.  Research technical flowchart

      1)ERA5辐射资料精度及订正效果采用相对误差、相关系数两个指标进行检验。

      2)分月采用线性回归建立区域ERA5辐射数据的订正方程。

      3)采用空间数据的转换、栅格数据的空间分析、地形因子提取等方法提取ERA5格点所处的地理空间属性数据。

      4)采用多元线性回归的方法建立区域ERA5辐射数据与地理属性的关系模型。

      5)将上述关系模型应用到房县全域坡度、坡向、海拔,得到分辨率为25 m × 25 m的全域太阳能资源分布。

      6)采用Arcgis中重采样、重分类、栅格计算的方法估算光伏技术开发量,各格点处的光伏技术开发量计算如式(1)所示:

      $$ E=P\times S\times \varepsilon $$ (1)
      $$ P=\frac{S _{\rm{S}}}{3.6\times h}\times 1000\times \eta $$ (2)

      式中:

      P ——各格点光伏发电技术可开发量(kW);

      S ——光伏电站技术可安装面积(m2);

      ε ——面积可利用率(%),按房县的土地利用类型,分别对不同类型的土地给予不同的面积可利用率;

      SS ——格点面积(m2);

      h ——1 a的小时数(h);

      η ——折减系数,取值为0.55。

      7)相关建模结果的准确性,用平均绝对百分比误差和平均偏差两个指标表示。

      (1)平均绝对百分比误差

      $$ {\rm{MAPE}} = \frac{1}{n}\sum\limits_{i = 1}^n {\frac{{\left| {{x_{ij}} - {x_i}} \right|}}{{{x_i}}}} \times 100\% $$ (3)

      (2)平均偏差

      $$ {\rm{MBE}} = \frac{1}{n}\sum\limits_{i = 1}^n {[{x_{ij}} - {x_i}]} $$ (4)

      式中:

      xij ——模拟的第i个格点的年总辐射(GJ/m2);

      xi ——第i个格点的年总辐射(GJ/m2)。

    • 采用2012年1月~2020年12月门古辐射站辐射资料,选取最邻近的ERA5格点同期2012年1月~2020年12月资料进行对比检验及订正。分月对比实测资料与ERA5格点资料之间的关系,从表1中可以看到,两种资料相关较好,各月相关均达到0.7以上。因此,采用线性方程建立分月订正模型,对房县境内所有格点资料进行订正。

      ab相关系数
      11.35−201.410.92
      20.76−39.230.88
      30.46120.870.73
      40.82−38.980.81
      50.85−55.880.90
      60.98−93.060.86
      71.06−135.220.93
      80.7928.340.84
      90.7429.240.88
      100.6351.990.88
      110.6142.390.74
      121.38−189.250.94

      Table 1.  Model coefficients of radiation data in Mengu observation station and ERA5

      研究时段门古站与对应的ERA5辐射产品在订正前后的累年、月总辐射的相对误差如表2所示。由表可见,原始ERA5与观测值间的年平均相对误差为31.2%,各月相对误差在18.8%~58.9%,冬季最高,夏季最低。分月进行线性回归订正后,年平均相对误差降至0.3%,各月相对误差在0.2%~7.1%之间。

      月份123456789101112
      未订正58.955.647.234.230.922.518.821.221.627.727.945.731.2
      分月订正4.30.27.10.91.51.51.81.50.91.51.11.50.3

      Table 2.  Mean absolute percentage errors (MAPEs) before and after the total radiation correction of Mengu radiation station and corresponding ERA5 products %

      综上,分月订正后的效果明显优于未订正效果,按照各月建立实测总辐射与ERA5总辐射的订正模型y = ax+b对房县区域内各格点进行修正,各月系数如表2所示。

    • 通过Arcgis提取房县区域的坡度、坡向和海拔高度3个地理因子,并进一步提取至各个ERA5格点。采用多元线性回归等方法,建立年平均总辐射与地理因子间的模型。另外,考虑不同季节地形对辐射的影响有差异,分别建立各月平均总辐射与地理因子的模型,模型形式如下式所示:

      $$ S={K}_{1}p+{K}_{2}a+{K}_{3}h+{D} $$ (5)

      式中:

      $ S $ ——总辐射(MJ/m2);

      $ p $ ——坡度(°);

      $ a $ ——坡向(°);

      $ h $ ——海拔高度(m);

      D ——常数项。

      各月系数($ {K}_{1} $~$ {K}_{3} $)和常数量${D}$如表3所示。

      月份$ {K}_{1} $$ {K}_{2} $$ {K}_{3} $${D }$
      1−0.244−0.0260.002230.106
      2−0.068−0.014−0.001230.534
      3−0.007−0.012−0.002347.431
      40.024−0.017−0.004416.118
      50.031−0.030−0.006442.199
      60.055−0.034−0.008482.772
      70.0620.0200.000478.186
      80.0590.0240.007414.940
      90.0000.0000.003330.350
      10−0.093−0.0200.000285.727
      11−0.055−0.0070.000210.924
      12−0.175−0.0150.001216.542

      Table 3.  Model established based on total radiation and geographical factors in each month

      为验证辐射模型的准确性,将房县另外两个实际辐射观测站西蒿坪和九道实际观测值与模型计算值进行对比,计算平均绝对百分比误差和平均偏差。结果如表4所示,西蒿坪站的年总辐射为4 041.9 MJ/m2,模拟值为4 271.9 MJ/m2,两者平均绝对百分比误差为5.7%,各月相对误差在2.0%~17.2%之间,其中2月、8月和11月、12月相关误差较大,超过10%。九道站的年总辐射为3 893.2 MJ/m2,模拟值为4 030.8 MJ/m2,两者平均绝对百分比误差为3.4%,各月相对误差在0.1%~15.4%之间,其中1月和6月相关误差较大,超过10%。总体来看,辐射模型能较准确地反映实际辐射分布情况。

      站点参数123456789101112
      西蒿坪 观测值 214.8 253.3 360.0 430.0 454.0 443.2 498.8 489.5 360.6 286.8 243.6 237.4 4 271.9
      计算值 219.3 224.7 343.1 410.0 432.1 470.7 483.4 428.8 333.9 279.2 207.8 208.8 4 041.9
      MBE/(MJ·m−2) −4.5 28.5 16.9 20.0 21.9 −27.5 15.3 60.6 26.7 7.6 35.8 28.6 230.0
      MAPE/% 2.0 12.7 4.9 4.9 5.1 5.8 3.2 14.1 8.0 2.7 17.2 13.7 5.7
      九道 观测值 189.3 223.6 335.5 388.2 393.7 392.0 484.6 455.1 335.5 267.1 219.9 208.7 3 893.2
      计算值 221.4 224.1 341.2 406.3 426.0 463.2 484.9 432.0 334.3 278.4 208.0 210.8 4 030.8
      MBE/(MJ·m-2) −32.2 −0.5 −5.7 −18.1 −32.3 −71.2 −0.4 23.1 1.2 −11.3 11.8 −2.1 −137.6
      MAPE/% 14.5 0.2 1.7 4.5 7.6 15.4 0.1 5.3 0.4 4.1 5.7 1.0 3.4

      Table 4.  Accuracy test of radiation model in each month and year

      经推算,房县市的太阳辐射量在4.00~4.13 GJ/(m2·a),年平均太阳总辐射量为4.067 GJ/(m2·a)。按照《太阳能资源评估方法》(GB/T 37526—2019)[19]中的划分标准,房县太阳能资源丰富程度均属于三级“资源丰富”地区。

      图3所示,全市太阳能资源的空间分布差异明显,总体呈现北高南低的分布特征。其中,中部河谷平坝地区太阳能资源相对较好,南部山区太阳能总辐射明显小于中北部区域。

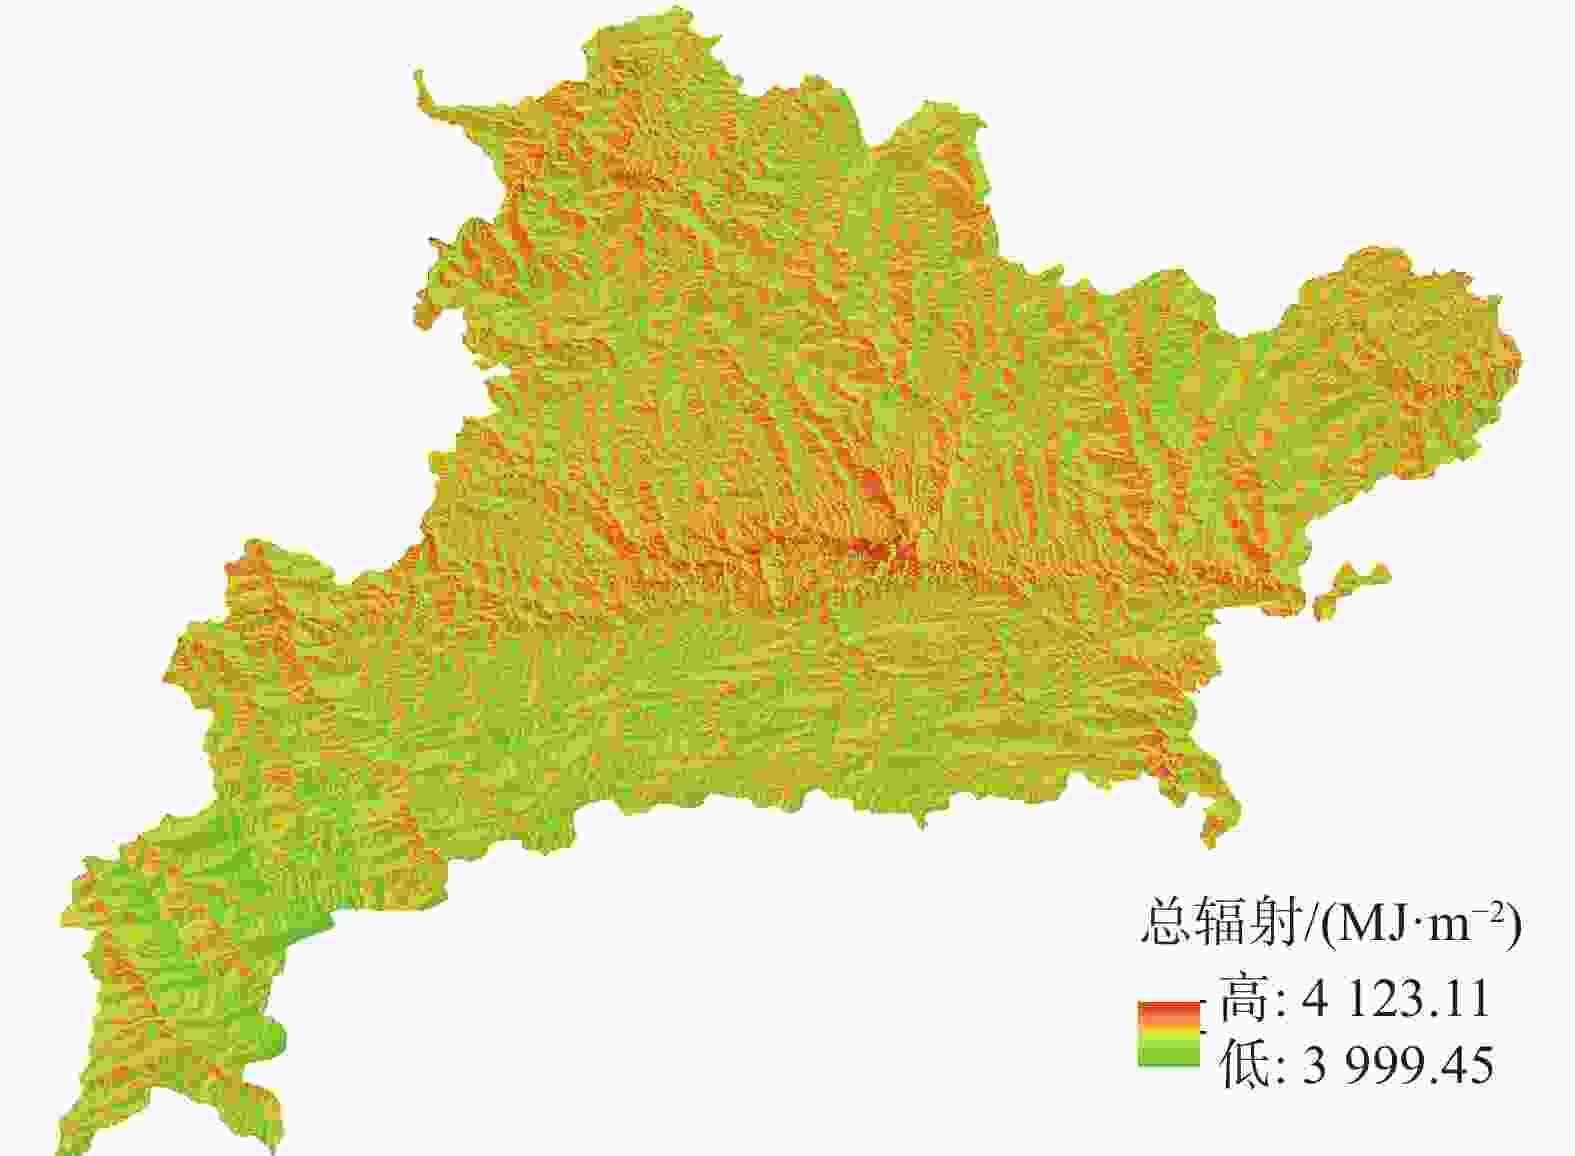
      Figure 3.  Distribution of annual average total solar radiation in Fangxian County

    • 实际太阳能资源开发利用时需综合考虑太阳能资源的总量和技术开发的难易程度[20],本文考虑土地利用类型对资源开发的限制来估算技术水平下的开发利用潜力。

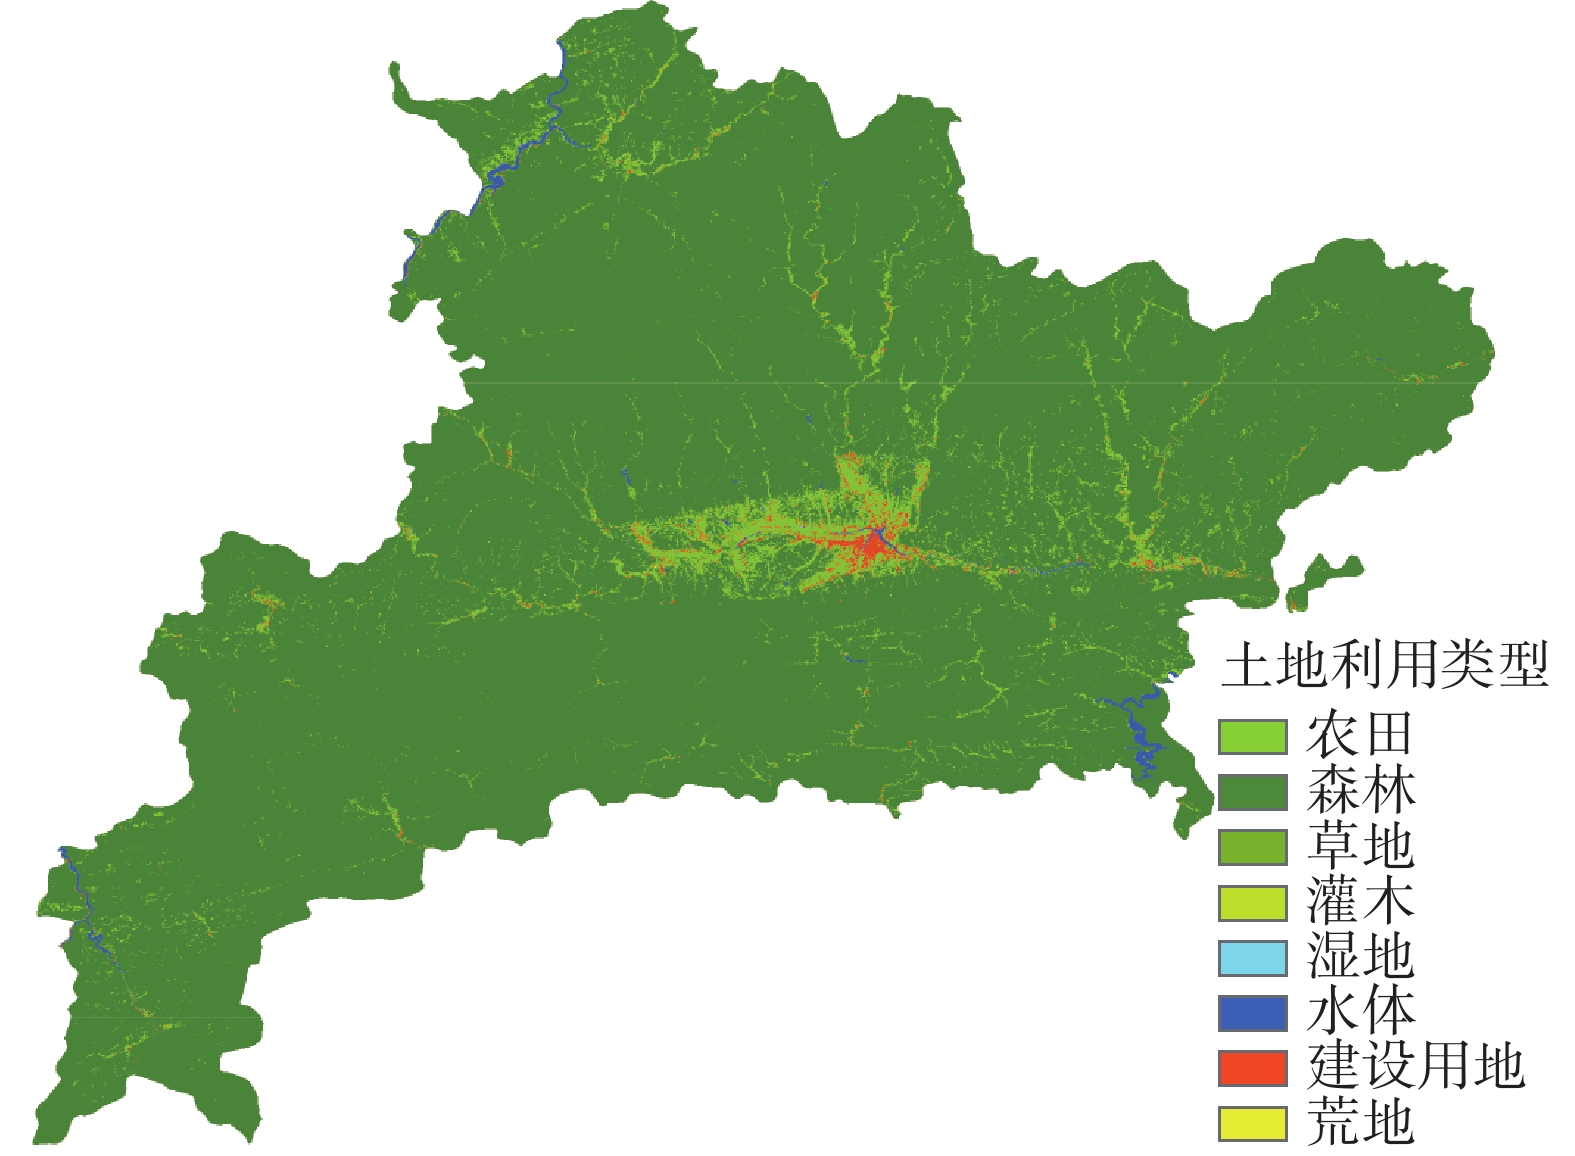
      根据卫星遥感观测的结果,将房县区域土地利用类型归为8大类(图4):农田(水浇地、水田、旱地、其他农业用地)、森林、草地、灌木、湿地、水体(河流、湖泊、库塘)、建设用地(建筑、人类活动用地、交通路网)、荒地或裸地。基于对不同土地利用类型的考虑,设置了不同的开发面积可利用率,如表5所示。其中,在实际的开发利用过程中,尽量避免占用耕地、林地,禁止占用生态湿地、水体两类土地类型。鼓励在城镇用地开展分布式光伏发电,在整块荒地推进光伏发电项目。因此,本研究中,房县地区优先考虑用于光伏开发的应是未利用的荒地和森林生态价值较低的草地、灌木及建设用地。

      Figure 4.  Land use types in Fangxian County

      土地利
      用类型
      可利用
      率/%
      可用面积/
      km2
      土地利
      用类型
      可利用
      率/%
      可用面积/
      km2
      农田 8 17.5 湿地 0 0.0
      森林 1 41.0 水体 0 0.0
      草地 10 2.2 建设用地 10 2.6
      灌木 10 0.4 荒地 20 0.1

      Table 5.  Area availability of lands of different use types in Fangxian County

      依据文献[14]、文献[21],同时考虑湖北省年总辐射分布及不同土地类型实际,得到不同土地类型对应的面积可利用率,得到房县总体的面积可利用率为1.5%,理论可利用面积为63.7 km2。按式(2)计算得到,可得到光伏装机技术可开发量。

      光伏发电技术可开发量与太阳能资源分布及土地利用分布两者紧密相关,总体上,中部乡镇光伏发电技术可开发量处于全县较高的水平,各乡镇技术可开发量如图5所示,根据计算,各乡镇中门古寺镇技术可开发量最大,达到409 MW,其次是青峰镇,为405 MW。房县全市的平均技术可开发量为4.501 GW。

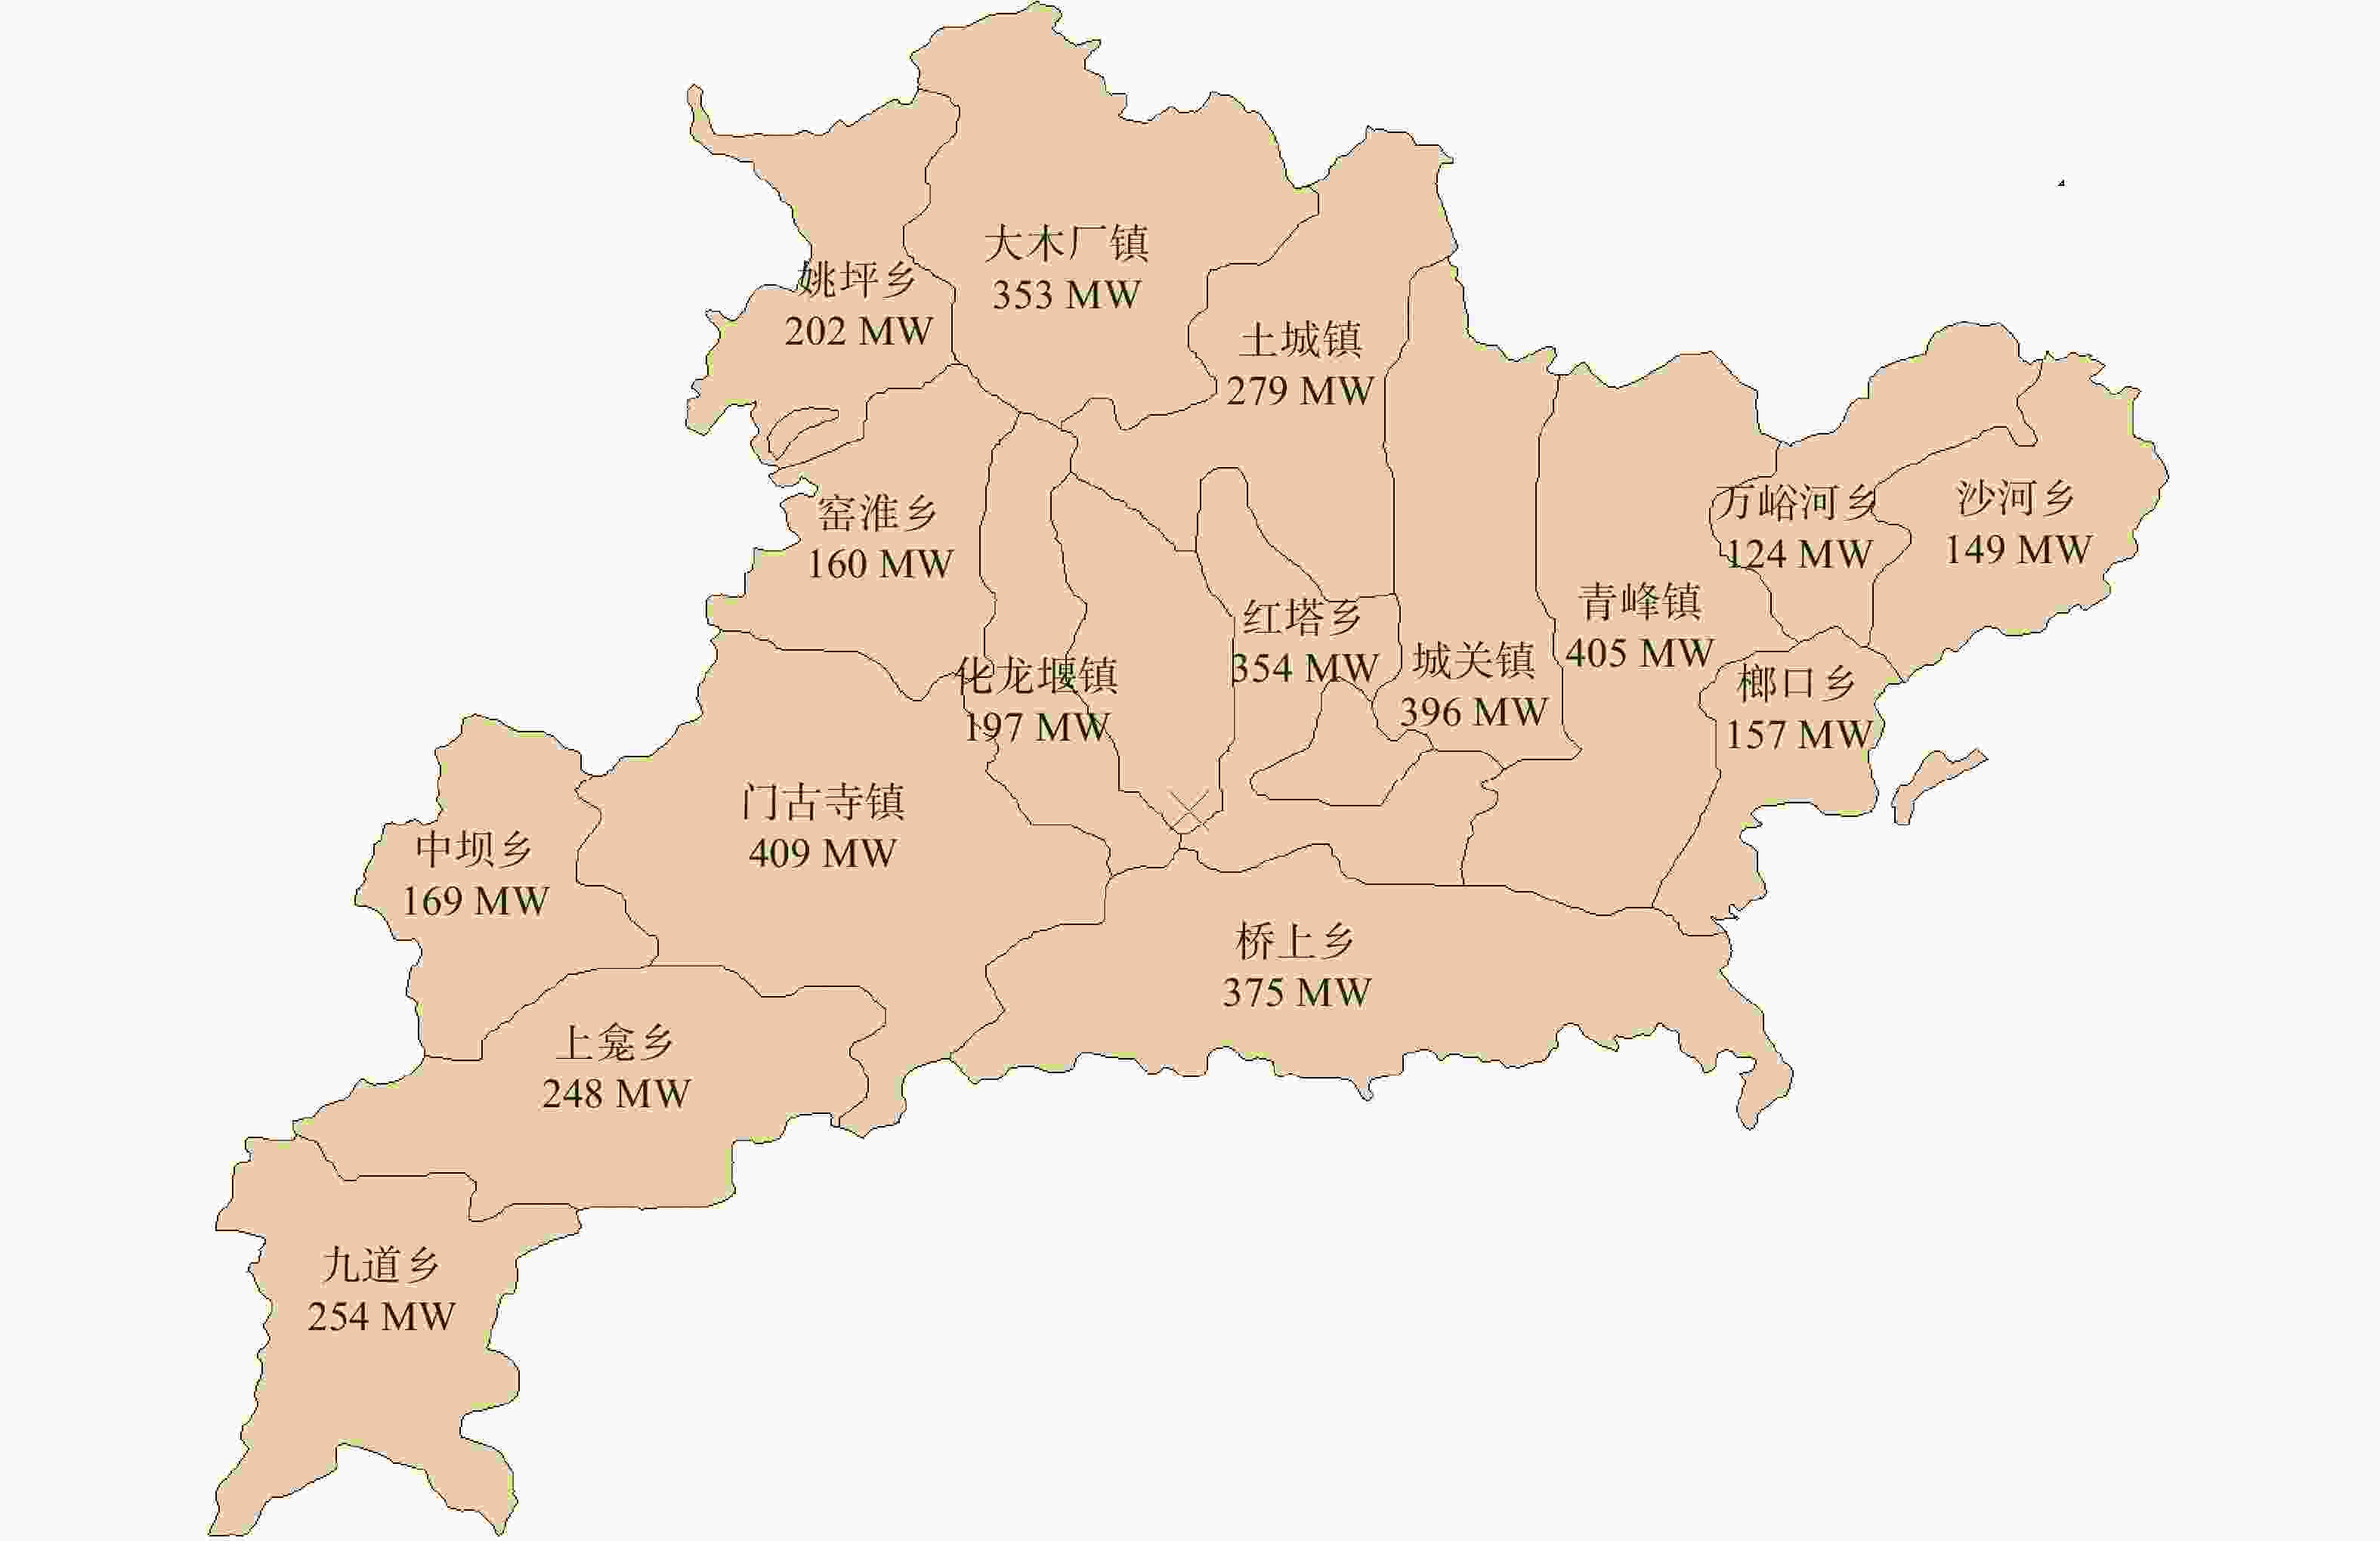
      Figure 5.  The exploitable capacity of photovoltaic technology in each township of Fangxian County

    • 精细化的太阳能资源评估是整县推进太阳能资源开发利用的基础,本文通过实际辐射观测结果对ERA5辐射产品进行检验订正后,考虑地形(坡度、坡向、海拔)对辐射的影响,基于GIS空间分析技术,推算了房县全域太阳能资源情况,综合考虑不同土地利用类型的可利用率,计算得到了光伏技术开发量。主要结论如下:

      1)原始ERA5辐射数据与观测值的年平均相对误差为31.2%,各月相对误差在18.8%~58.9%,存在明显高估的情况。通过实际辐射观测数据进行分月建模订正后,年平均相对误差降至0.3%,各月相对误差在0.2%~7.1%之间。

      2)提取坡度、坡向和海拔高度3个地理因子,建立基于地形的辐射计算模型。将两个实际辐射观测站西蒿坪和九道实际观测值与模型计算值进行对比,西蒿坪站的年平均绝对百分比误差为5.7%,九道站的年平均绝对百分比误差为3.4%,辐射模型能较准确地反映实际辐射分布情况。

      3)计算得到的房县年平均太阳总辐射为4.067 GJ/m2,年平均太阳总辐射量全市的空间分布在4 405.8~4 676.7 MJ/m2,空间分布差异明显,总体呈现北高南低的分布特征。其中,中部河谷平坝地区太阳能资源相对较好,南部山区太阳能总辐射明显小于中北部区域。全市太阳能资源均处于“丰富”等级。综合考虑不同土地类型的可利用率,全市总体土地可利用率为1.5%,可利用面积为60.7 km2,估算得到光伏发电技术可开发量为4.501 GW。

Reference (21)

Catalog

    /

    DownLoad:  Full-Size Img  PowerPoint
    Return
    Return