• Peer Review
  • Non-profit
  • Global Open Access
  • Green Channel for Rising Stars
Volume 4 Issue 3
Jul.  2020
Turn off MathJax
Article Contents

Yuancan ZHUANG, Jianquan ZHU, Junming HUANG. Analysis of Line Loss Characteristics and Influencing Factors of Distribution Network Based on Metrological Automation System[J]. SOUTHERN ENERGY CONSTRUCTION, 2017, 4(3): 63-68,74. doi: 10.16516/j.gedi.issn2095-8676.2017.03.012
Citation: Yuancan ZHUANG, Jianquan ZHU, Junming HUANG. Analysis of Line Loss Characteristics and Influencing Factors of Distribution Network Based on Metrological Automation System[J]. SOUTHERN ENERGY CONSTRUCTION, 2017, 4(3): 63-68,74. doi: 10.16516/j.gedi.issn2095-8676.2017.03.012

Analysis of Line Loss Characteristics and Influencing Factors of Distribution Network Based on Metrological Automation System

doi: 10.16516/j.gedi.issn2095-8676.2017.03.012
  • Received Date: 2017-03-06
  • Publish Date: 2020-07-18
  • The line loss rate is an important comprehensive index of technology and economy of distribution network. In order to facilitate line loss management, this paper takes an actual 10kV distribution network in Dongguan as an example to study the characteristics of line loss and its influencing factors based on the data of metrological automation system. Firstly, the monthly variation characteristics and the composition of the line loss are analyzed, and the influence of power supply, average load factor, minimum load factor, shape factor and power factor on line loss is revealed by correlation coefficient. The line loss of the monthly working days and holidays are further analyzed, revealing the differences of the characteristics of the two and the causes. Finally, the analysis system of the line loss characteristics and the influencing factors in three time dimensions is established. In this way, the change characteristics of line loss can be reflected fully. The various factors of line loss also can be analyzed quantitatively.
  • [1] 田宏杰. 线损分析预测在供电管理中的应用 [J]. 电力系统保护与控制,2010, 38(7): 77-80.

    TIAN H J. Application on line loss analyzing forecast in power supply management [J]. Power System Protection and Control, 2010, 38(7): 77-80.
    [2] 李喜来,李永双,贾江波,等. 中国电网技术成就、挑战与发展 [J]. 南方能源建设,2016, 3(2): 1-8.

    LI X L, LI Y S, JIA J B, et al. Review of the achievements, challenges and development of power system technology in China [J]. Southern Energy Construction, 2016, 3(2): 1-8.
    [3] 余南华,陈炯聪,高新华. 广东电网线损“四分”管理的分析与对策 [J]. 广东电力,2007,20(11):14-17.

    YU N H, CHEN J C, GAO X H. Analysis of four-ins line loss management of guangdong power grid and countermeasures against existing problems [J]. Guangdong Electric Power, 2007, 20(11):14-17.
    [4] 李妍红,刘明波,陈荃. 配电网低压动态无功补偿降损效果评估[J]. 电网技术,2006,30(19): 81-85.

    LI Y H, LIU M B, CHEN Q. Evaluation on effect of reducing network loss in distribution network by low voltage dynamic reactive power compensation equipment [J]. Power System Technology, 2006, 30(19): 81-85.
    [5] 陈海涵,程启诚. 等值电阻法计算配电网损耗的理论和实践 [J]. 广东电力,2004, 17(3): 5-8.

    CHEN H H, CHENG Q C. Theory and practice of distribution network loss calculation through method of equivalent resistance [J]. Guangdong Electric Power, 2004, 17(3): 5-8.
    [6] 中国电机工程学会城市供电专业委员会. 电力网电能损耗计算导则:DL/T686—1999 [S]. 北京:中国电力出版社,2000.
    [7] 王琨,刘丽平. 10 kV线损理论计算方法的误差分析 [J]. 电力学报,2002, 17(4): 251-253+256.

    WANG K, LIU L P. Error analysis on 10 kV line loss with theoretical calculating method [J]. Journal of Electric Power, 2002, 17(4): 251-253+256.
    [8] 傅志伟,刘会金. 考虑负荷曲线和发电出力曲线影响的电力系统网损计算 [J]. 广西电力,2004, 27(4): 1-3.

    FU Z W, LIU H J. The calculation for grid energy losses of electric power system considering the effect by load curves and output curves from generators [J]. Guangxi Electric Power, 2004, 27(4): 1-3.
    [9] 张宗伟,张鸿. 基于负荷实测的配电网线损理论计算 [J]. 电力系统保护与控制,2010, 38(14): 115-119.

    ZHANG Z W, ZHANG H. Theoretical calculation on distribution network line loss based on measurement-based load [J]. Power System Protection and Control, 2010, 38(14): 115-119.
    [10] 汪永华,王正风. 基于SCADA/EMS的负荷实测与网损在线计算的研究与应用 [J]. 电力系统保护与控制,2012,40(4):96-100.

    WANG Y H, WANG Z F. Research and application of power load measurement and on-line power network loss compute based on SCADA/EMS system [J]. Power System Protection And Control, 2012, 40(4):96-100.
    [11] 李滨,杜孟远,韦维,等. 基于准实时数据的智能配电网理论线损计算 [J]. 电力自动化设备,2014,34(11):123-128.

    LI B, DU M Y, WEI W,et al. Calculation of theoretical line loss based on quasi real-time data of smart distribution network [J]. Electric Power Automation Equipment, 2014,34(11):123-128.
    [12] 张恺凯,杨秀媛,卜从容,等. 基于负荷实测的配电网理论线损分析及降损对策 [J]. 中国电机工程学报,2013,33(S):92-97.

    ZHANG K K, YANG X Y, BU C R,et al. Theoretical analysis on distribution network loss based on load measurement and countermeasures to reduce the loss [J]. Proceeding of the CSEE, 2013, 33(S): 59-63.
    [13] 余卫国,熊幼京,周新风,等. 电力网技术线损分析及降损对策 [J].电网技术,2006,30(18): 54-57+63.

    YU WG, XIONG Y J, ZHOU X F, et al. Analysis on technical line losses of power grids and countermeasures to reduce line losses [J]. Power System Technology, 2006, 30(18):54-57+63.
    [14] 刘健,段璟靓. 配电网极限线损分析及降损措施优化 [J]. 电力系统保护与控制,2013,41(12):27-35.

    LIU J, DUAN J J. Line loss limitation analysis and optimal planning of loss reduction for distribution grids [J]. Power System Protection and Control, 2013, 41(12):27-35.
    [15] 冯垚,李明浩,莫玫,等. 线损率波动与影响因素的数学建模及求解 [J]. 电力系统及其自动化学报,2010,22(5):116-120.

    FENG Y, LI M C, MO M, et al. Methematical modeling and solution on distribution synthesis loss rate fluctuations and factors [J]. Proceedings of the CSU-EPSA,2010, 22 (5): 116-120.
    [16] 冉兵,宋晓辉. 配电网线损影响因素分析 [J]. 华中电力,2009,22(6):30-33.

    RAN B, SONG X H. Analysis on influencing factors of distribution network line loss [J]. Central China Electric Power, 2009, 22(6): 30-33.
    [17] 苏志雄,曾民星,孔灿,等. 基于线损影响因素的配电网线损计算方法研究 [J]. 电气应用,2013(增刊2): 413-416.

    SU Z X, ZENG M X, KONG C, et al. Research on distribution network line loss calculation method based on line loss impact factors [J]. Electrotechnical Application,2013(Supp. 2):413-416.
    [18] 傅鹏,江振源,李蒙赞. 配电网技术线损影响因素 [J]. 山西电力,2016(5):30-33.

    FU P, JIANG Z Y, LI M Z. Influencing factors on technical line losses of distributed network [J]. Shanxi Electric Power, 2016(5):30-33.
    [19] 徐维超. 相关系数研究综述 [J]. 广东工业大学学报,2012,29(3): 12-17.

    XU W C. A review on correlation coefficients [J]. Journal of Guangdong University of Technology, 2012, 29(3):12-17.
    [20] 平狄克,鲁宾费尔. 计量经济模型与经济预测 [M]. 北京:机械工业出版社,2003.

    PINDYCK R S, RUBINFELD D L. Econometric models and economic forecasts [M]. Beijing: China Machine Press, 2003.
  • 通讯作者: 陈斌, bchen63@163.com
    • 1. 

      沈阳化工大学材料科学与工程学院 沈阳 110142

    1. 本站搜索
    2. 百度学术搜索
    3. 万方数据库搜索
    4. CNKI搜索

Figures(13)

Article Metrics

Article views(355) PDF downloads(19) Cited by()

Related

Analysis of Line Loss Characteristics and Influencing Factors of Distribution Network Based on Metrological Automation System

doi: 10.16516/j.gedi.issn2095-8676.2017.03.012

Abstract: The line loss rate is an important comprehensive index of technology and economy of distribution network. In order to facilitate line loss management, this paper takes an actual 10kV distribution network in Dongguan as an example to study the characteristics of line loss and its influencing factors based on the data of metrological automation system. Firstly, the monthly variation characteristics and the composition of the line loss are analyzed, and the influence of power supply, average load factor, minimum load factor, shape factor and power factor on line loss is revealed by correlation coefficient. The line loss of the monthly working days and holidays are further analyzed, revealing the differences of the characteristics of the two and the causes. Finally, the analysis system of the line loss characteristics and the influencing factors in three time dimensions is established. In this way, the change characteristics of line loss can be reflected fully. The various factors of line loss also can be analyzed quantitatively.

Yuancan ZHUANG, Jianquan ZHU, Junming HUANG. Analysis of Line Loss Characteristics and Influencing Factors of Distribution Network Based on Metrological Automation System[J]. SOUTHERN ENERGY CONSTRUCTION, 2017, 4(3): 63-68,74. doi: 10.16516/j.gedi.issn2095-8676.2017.03.012
Citation: Yuancan ZHUANG, Jianquan ZHU, Junming HUANG. Analysis of Line Loss Characteristics and Influencing Factors of Distribution Network Based on Metrological Automation System[J]. SOUTHERN ENERGY CONSTRUCTION, 2017, 4(3): 63-68,74. doi: 10.16516/j.gedi.issn2095-8676.2017.03.012
  • 线损率是一项重要的综合性技术经济指标。目前我国配电网的建设相对主网更为落后,致使配电网的线损率整体偏高。对配电网的线损特征进行分析,揭示线损的变化规律及其影响因素,对线损管理具有重要意义[1,2,3,4]

    已有的配电网线损研究工作主要集中在理论线损计算及分析方面。针对理论线损计算问题,目前应用最为广泛的是均方根电流法和等值电阻法[5,6]。这两种方法原理简单,对数据要求低,仅需利用代表日内的电流或电量数据,因而具有较强的工程实用性。但是这两种方法对问题进行大量的简化,无法精确反映电压、电流、实际负荷分布状态等因素对线损的影响情况,极端情况下可能出现较大的误差[7,8]。为了解决这一问题,文献[9]提出了基于自动数据采集系统的线损计算方法;文献[10]采用SCADA/EMS的实测数据实现线损在线计算;文献[11]基于测量终端数据进行潮流计算,进而掌握配电网的线损情况。这些方法在较大程度上提高了线损的计算精度。

    在线损分析方面,文献[12,13]按分压、分元件的方式对线损的构成情况进行分析,并提出相应的降损策略。文献[14]提出了配电网的极限线损分析方法,以此揭示其降损潜力。文献[15,16]将配电网线损影响因素分为电网规划建设因素、电网技术因素、运行管理因素及其它外在因素,并重点分析了三相不平衡对线损的影响情况。文献[17,18]讨论了网络拓扑结构、电源数量以及线路长度对线损的影响情况,并基于这些影响因素建立了线损计算模型。这些研究各有特点,为线损管理奠定了理论基础,但主要还存在以下两个方面的问题:一是只分析单个时间维度的线损情况,难以揭示线损在多个时间维度的变化特征;二是侧重于从配电网元件参数的角度对线损的影响因素进行研究,缺少对配电网状态的分析。

    本文基于广东电网计量自动化系统的计量数据,对线损的特征及其影响因素展开研究。广东电网计量自动化系统已在发电厂、变电站、线路、工业大客户、公变台区、低压居民用户大规模安装运行电表、厂站终端、负荷管理终端、配变计量终端、低压集抄等计量设备。目前广东电网计量自动化系统已具有1万个厂站计量点,并实现了10 kV配电网46万个配变终端计量点的100%覆盖及远程监测,低压用户集中抄表覆盖约1 000万户,覆盖率为37.8%。根据“十三五”配电网规划,到2020年,广东电网智能电表、低压集抄可实现100%覆盖,由此产生的大量计量数据及电力监测数据,可为配电网线损计算及分析提供全面的数据支撑。

    本文以东莞某10 kV配电网为例,基于广东电网计量自动化系统的数据对其线损特征及影响因素进行分析。首先揭示月内各天的线损率及线损构成情况,并运用相关系数法对线损率及影响因素进行定量分析;再研究工作日和节假日内各个时段的线损率及线损构成情况,揭示两者的差异及原因,为配电网的线损管理提供依据。

  • 考虑到目前统计线损的精度比较低,本文利用理论线损对配电网线损的变化特征进行分析,具体采用文献[9]所提的基于负荷实测的线损理论计算方法计算得到。其基本原理是根据计量自动化系统采集的配电网各个负荷节点的功率、电压和电流数据,逐段推出各个线路元件的可变损耗,再结合固定损耗,便可得到配电网的总线损为

    ((1))

    式中:ΔWLi为第i段线路的损耗;n为线路总段数;ΔWTi为第i台公用变压器的损耗;m为公用变压器的总数;ΔW为总线损。

    进一步可得到线损率为

    ((2))

    式中:A为供电量;λ为线损率。

  • 广东电网计量自动化系统可以实时采集配电网的众多运行数据,包括:配电网的供电量、电压、电流、相角、功率、功率因素等,从而全面反映配电网的实时运行状态。文献[15,16,17]指出,供电量、平均负荷系数、最小负荷系数、形状系数和功率因数是线损率的重要影响因素。其中,平均负荷系数为日平均负荷与最大负荷的比值;日最小负荷系数为最小负荷与最大负荷的比值;形状系数为电流有效值与平均值之比。但是上述文献仅定性地分析线损率的各种影响因素,并未提及这些因素对线损率的影响程度。

    本文进一步利用相关系数法对线损率的各种影响因素进行定量分析。相关系数法已在经济、医学、电力行业等诸多领域的影响因素分析中得到了成功的应用[19,20]。其计算公式为

    ((3))

    式中:xi为阶段i的线损率;为各阶段的线损率的平均值;yixi对应的影响因素值,为各阶段的影响因素的平均值;n为线损率的总数。

    本文从供电量、平均负荷系数、最小负荷系数、形状系数和功率因数5个方面对月度的线损影响因素进行分析,重点揭示这些因素对配电网线损率的定量影响情况。在研究典型日的线损影响因素时,由于主要是从该日各个时段的线损变化情况进行分析,并不存在日平均负荷系数、最小负荷系数的问题,本文仅考虑供电量和形状系数这2种影响因素。

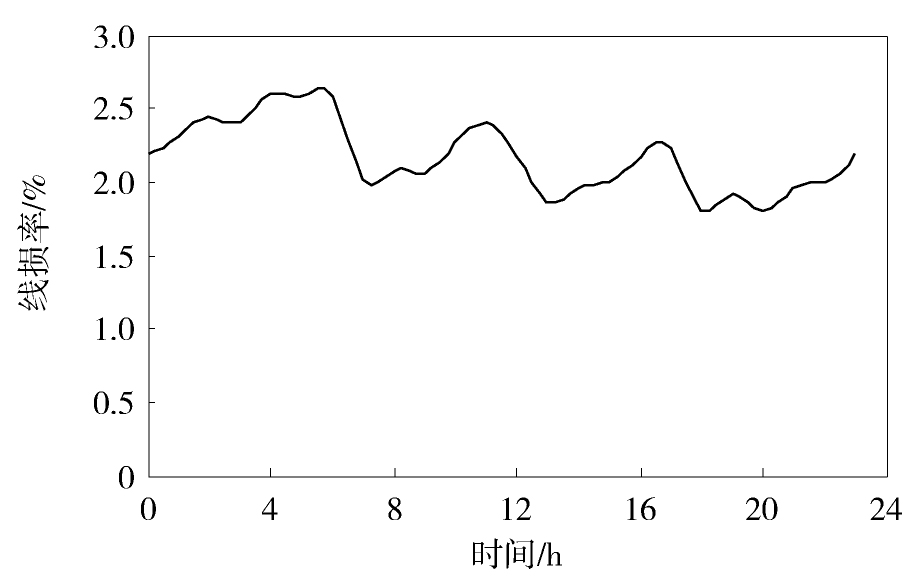
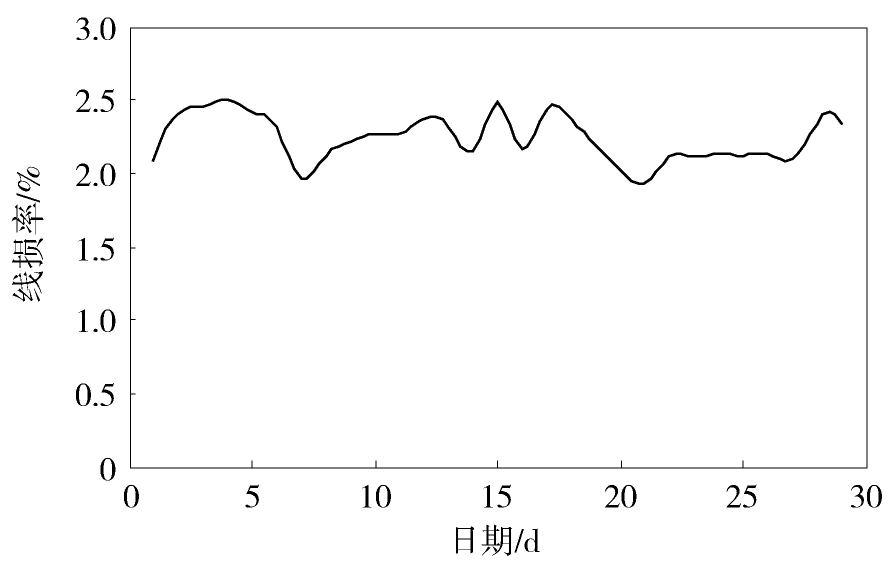
  • 图1给出了东莞某10 kV配电网的线损率在月内的变化情况。从中可见,该月内的线损率主要在2%~2.5%之间波动,线损率总体比较低。这主要是因为,该配电网的变压器包含较多的专用变压器,其损耗不计入配电网的线损计算中;此外,该配电网的线路普遍较短且多数为截面积较大的电缆,这部分线种产生的损耗也比较小。

    Figure 1.  Curve of monthly line loss rate

    图1还可以看出,月内的线损率体现出一定的周期变化特性,波动周期约为一周。在前半周,线损率逐步上升,在后半周,线损率则逐渐下降,并在周末达到最低点。

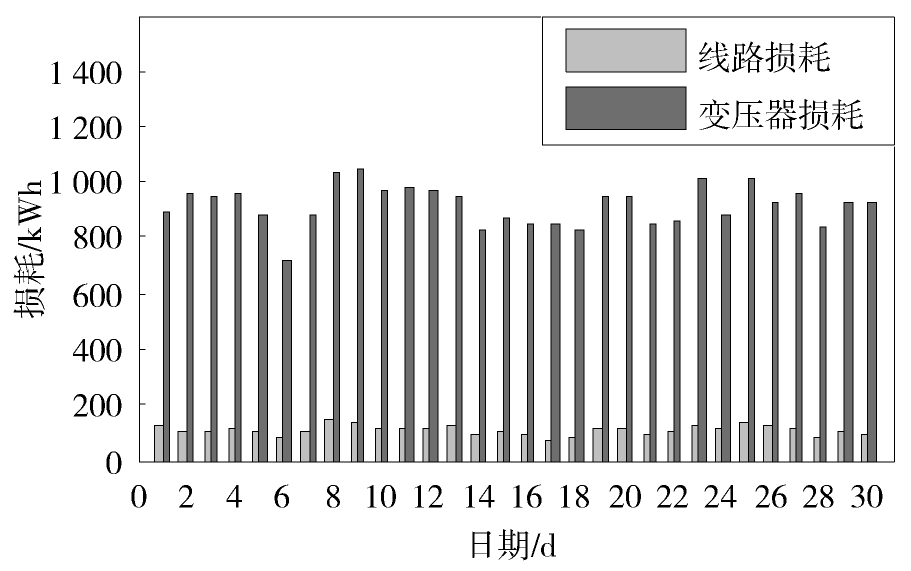
    图2给出了配电网的线损在月内的构成变化情况。从中可见,该配电网的变压器损耗远大于线路损耗,是线损的主要来源。这两种损耗也是以周为周期进行变化,在周末出现一定的下降。

    Figure 2.  Composition of monthly line loss rate
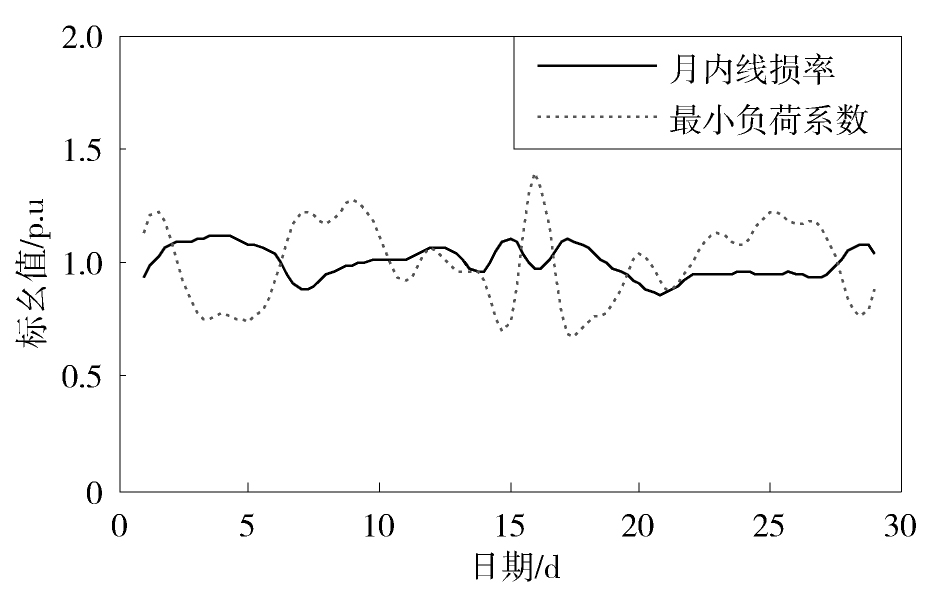
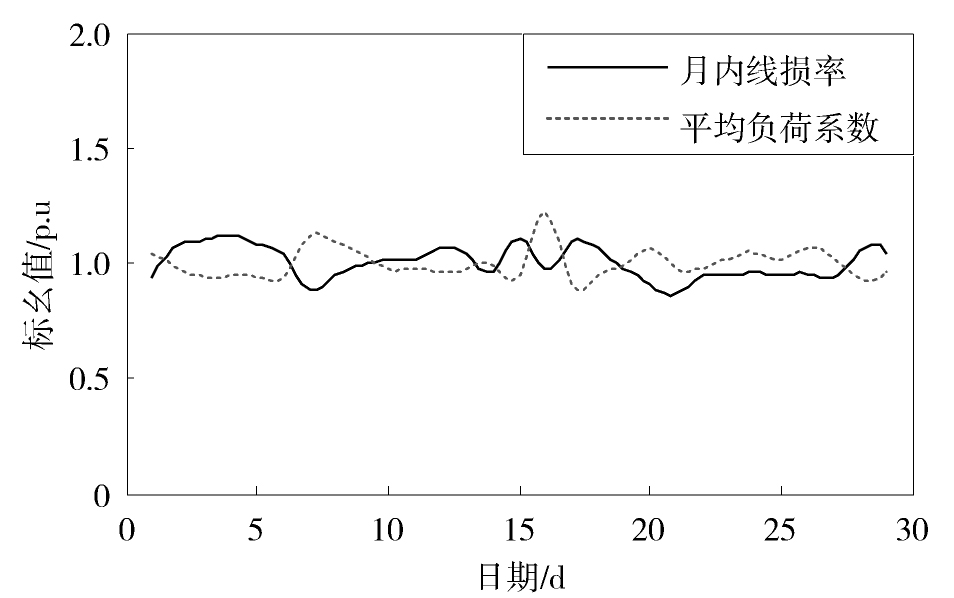
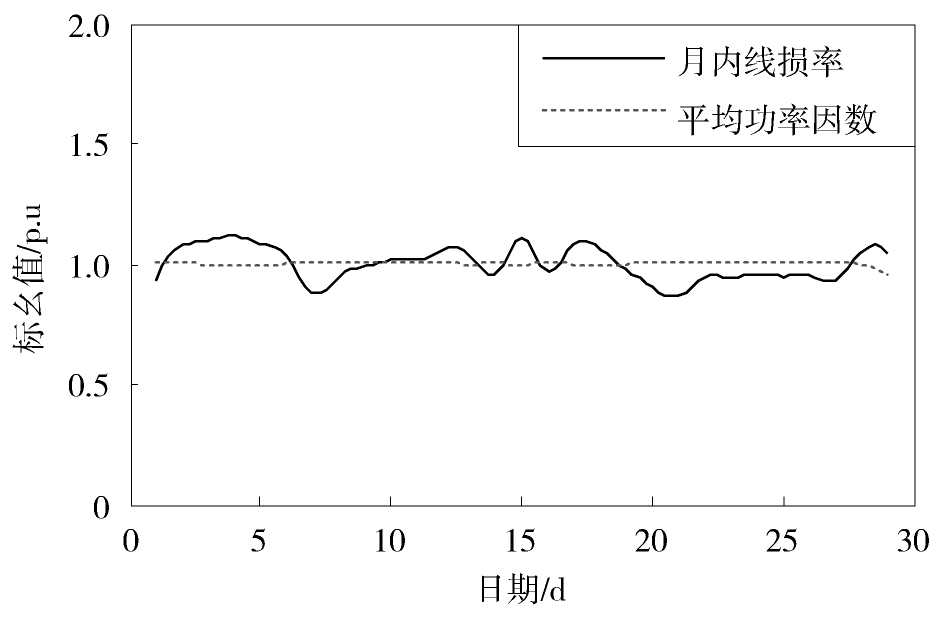
  • 图3图4图5图6图7给出了配电网的线损及其与某一影响因素在月内的对比变化曲线,并利用式(3)计算得到两者的相关系数。从图3图4图5可见,最小负荷系数、平均负荷系数和供电量的变化趋势与线损率的变化趋势总体上是相反的。经计算得到这三种影响因素与线损率的相关系数分别为-0.60、-0.64和-0.62,这说明它们与线损率具有负相关的关系,且对线损率的影响比较显著。

    Figure 3.  Comparison of monthly line loss rate and minimum load factor

    Figure 4.  Comparison of monthly line loss rate and average load factor

    Figure 5.  Comparison of monthly line loss rate and power supply

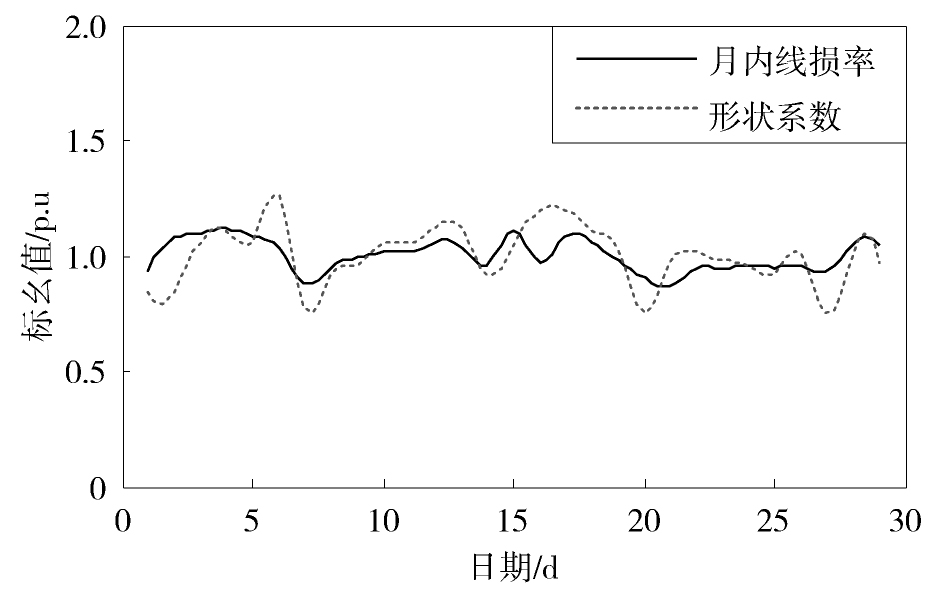
    Figure 6.  Comparison of monthly line loss rate and shape factor

    Figure 7.  Comparison of monthly line loss rate and power factor

    图6中可见,形状系数增大时线损率升高,负荷形状系数减小时线损率下降,这说明这两者之间具有正相关关系。进一步计算得到它们的相关系数为0.7,说明形状系数对线损率具有较大的影响。

    图7可以看到,配电网的功率因数在月内的波动情况较小,基本上为一条直线。理论计算后发现,功率因数与线损率的相关系数仅为-0.2,因而在线损管理中可以忽略功率因数的影响。

  • 图8给出了东莞某10 kV配电网的线损率在某一工作日的变化曲线。从中可见,该日的线损率主要在2%~2.5%之间波动,在凌晨5点、上午11点、下午4点和晚上23点出现了四个波峰。

    Figure 8.  Curve of line loss rate on monthly working day
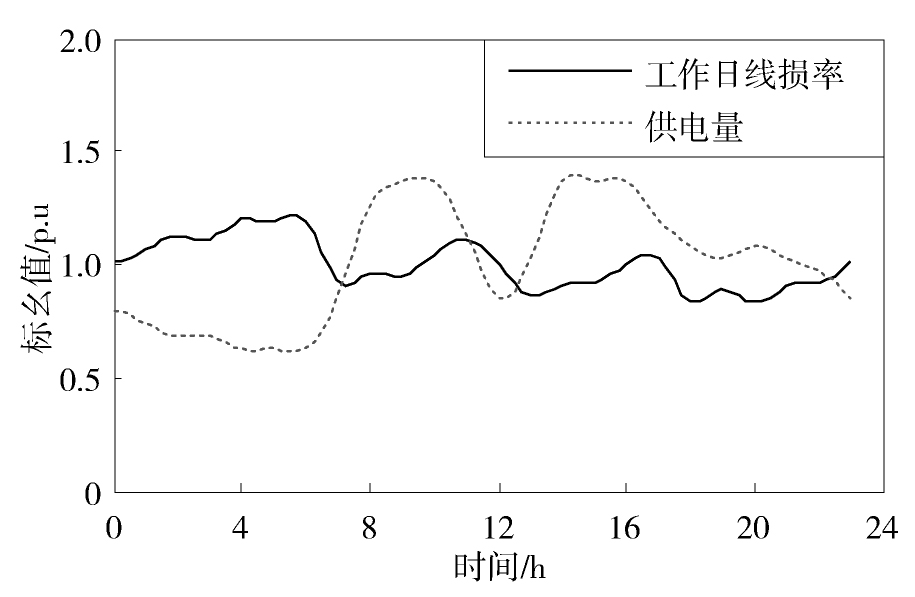
    图9图10分别给出了工作日的线损率与供电量和负荷形状系数的对比变化曲线。从图9可以发现,工作日的用电量曲线存在三个高峰,但是这些高峰出现的时刻与线损率高峰出现的时刻并不相同。通过计算发现工作日的用电量与线损率的相关系数为-0.6,说明工作日的用电量与线损率是负相关的,随着供电量的提高,配电网的线损率总体呈下降趋势。

    Figure 9.  Comparison of loss rate and power supply on working day

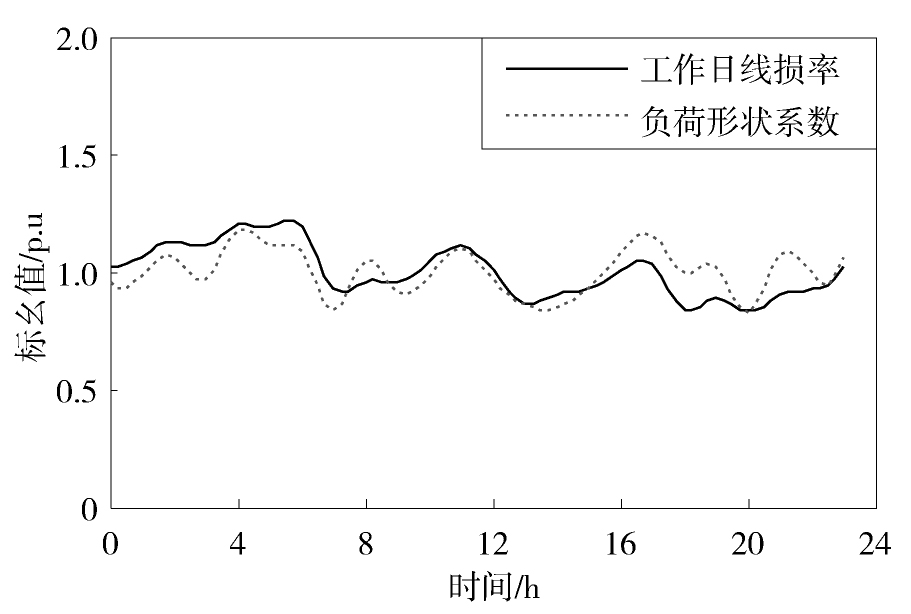
    Figure 10.  Comparison of loss rate and shape factor on working day

    图10可见,负荷形状系数变化较快,一天之内存在多个波峰。但从整体上看,在线损率处于波峰时,负荷形状系数大部分也处于波峰的位置,说明两者具有正相关的关系。经计算得到两者的相关系数为0.65,说明负荷形状系数对线损率具有较大的影响。

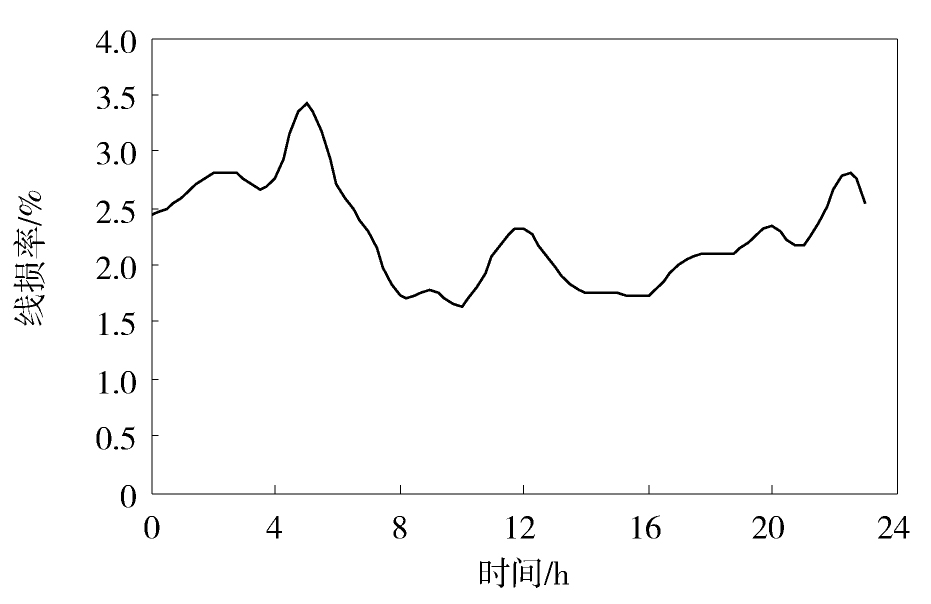
  • 图11给出了东莞某10 kV配电网的线损率在某一节假日的变化曲线。从中可见,节假日线损率主要在1.5%~3.5%之间波动,变化范围大于工作的情况。此外,节假日线损率在凌晨4点、中午12点和晚上23点出现三个波峰,波峰数比工作日少一个。

    Figure 11.  Curve of line loss rate on holiday
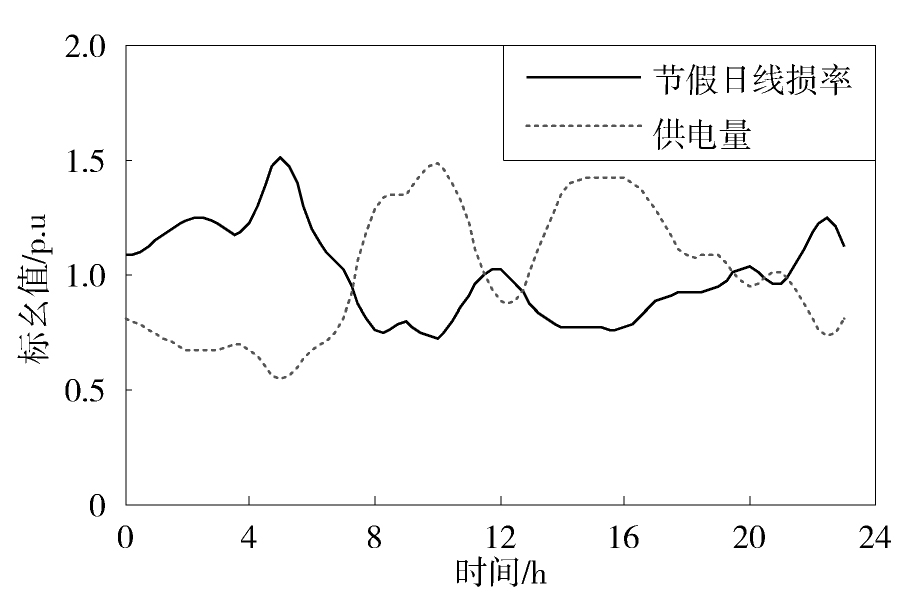
    图12图13分别给出了节假日的线损率与供电量和负荷形状系数的对比变化曲线。从图12看,节假日的供电量比工作日小,但供电量的变化形状差异不大。但计算后发现,节假日的线损率与供电量相关系数为-0.95,其绝对值远高于工作日时的-0.6。这说明节假日时供电量对线损率具有极大的影响。

    Figure 12.  Comparison of loss rate and power supply on holiday

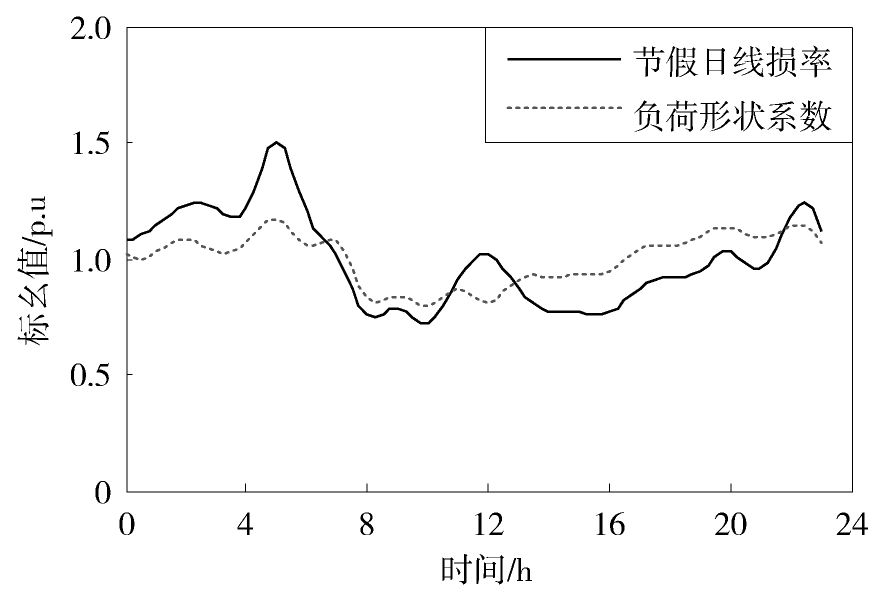
    Figure 13.  Comparison of loss rate and shape factor on holiday

    图13中可见,节假日线损率和负荷形状系数的变化趋势基本一致,可见两者是正相关的。计算后得到两者的相关系数为0.71,高于工作日的情况,这说明节假日时负荷形状系数对线损率的影响比工作日时大。

    从上述计算结果还可以看到,大部分情况下线损率与某一影响因素的相关系数均小于0.71,这也从侧面说明单一的影响因素并未完全反映线损率的变化情况。在进行配电网降损、线损异常监测等应用时,可先根据这些影响因素与线损率的相关系数确定出其中的关键因素,再综合考虑这些关键因素以制订相应的策略。

  • 通过上述研究发现,形状系数、平均负荷系数、最小负荷系数和供电量对东莞某实际10kV配电网的线损率具有较大影响。为了降低该配电网的线损率,可以采取以下的措施:

    1)考虑到该配电网的负荷形状系数与线损率具有正相关的关系,平均负荷系数和最小负荷系数与线损率具有负相关的关系,可通过分时电价、储能等方式对负荷进行调控,以减小其形状系数,增大其平均负荷系数和最小负荷系数,进而降低配电网的损耗率。

    2)由于该配电网长期处于轻载状态,固定损耗占比过大,致使其供电量与线损率出现负相关关系。在配电网的升级改造过程中,可适当增加该配电网的供电量,以降低其线损率。

  • 本文基于广东电网计量自动化系统的数据,对东莞某10kV配电网的线损变化特征及影响因素展开分析,主要结论如下:

    1)该配电网的线损率总体较低,其中变压器损耗占比远大于线路损耗,是线损的主要来源。

    2)该配电网的线损率体现出一定的周期波动性;节假日的线损率和波动范围均高于工作日。

    3)最小负荷系数、平均负荷系数、负荷形状系数和供电量均对线损率具有较大的影响,其中最小负荷系数、平均负荷系数和供电量与线损率负相关,负荷形状系数与线损率正相关;功率因数对配电网线损率的影响较小。

Reference (20)

Catalog

    /

    DownLoad:  Full-Size Img  PowerPoint
    Return
    Return